Immigrants from Philippines vs Arapaho 1 or more Vehicles in Household
COMPARE
Immigrants from Philippines
Arapaho
1 or more Vehicles in Household
1 or more Vehicles in Household Comparison
Immigrants from Philippines
Arapaho
91.5%
1 OR MORE VEHICLES IN HOUSEHOLD
99.4/ 100
METRIC RATING
77th/ 347
METRIC RANK
92.7%
1 OR MORE VEHICLES IN HOUSEHOLD
100.0/ 100
METRIC RATING
20th/ 347
METRIC RANK
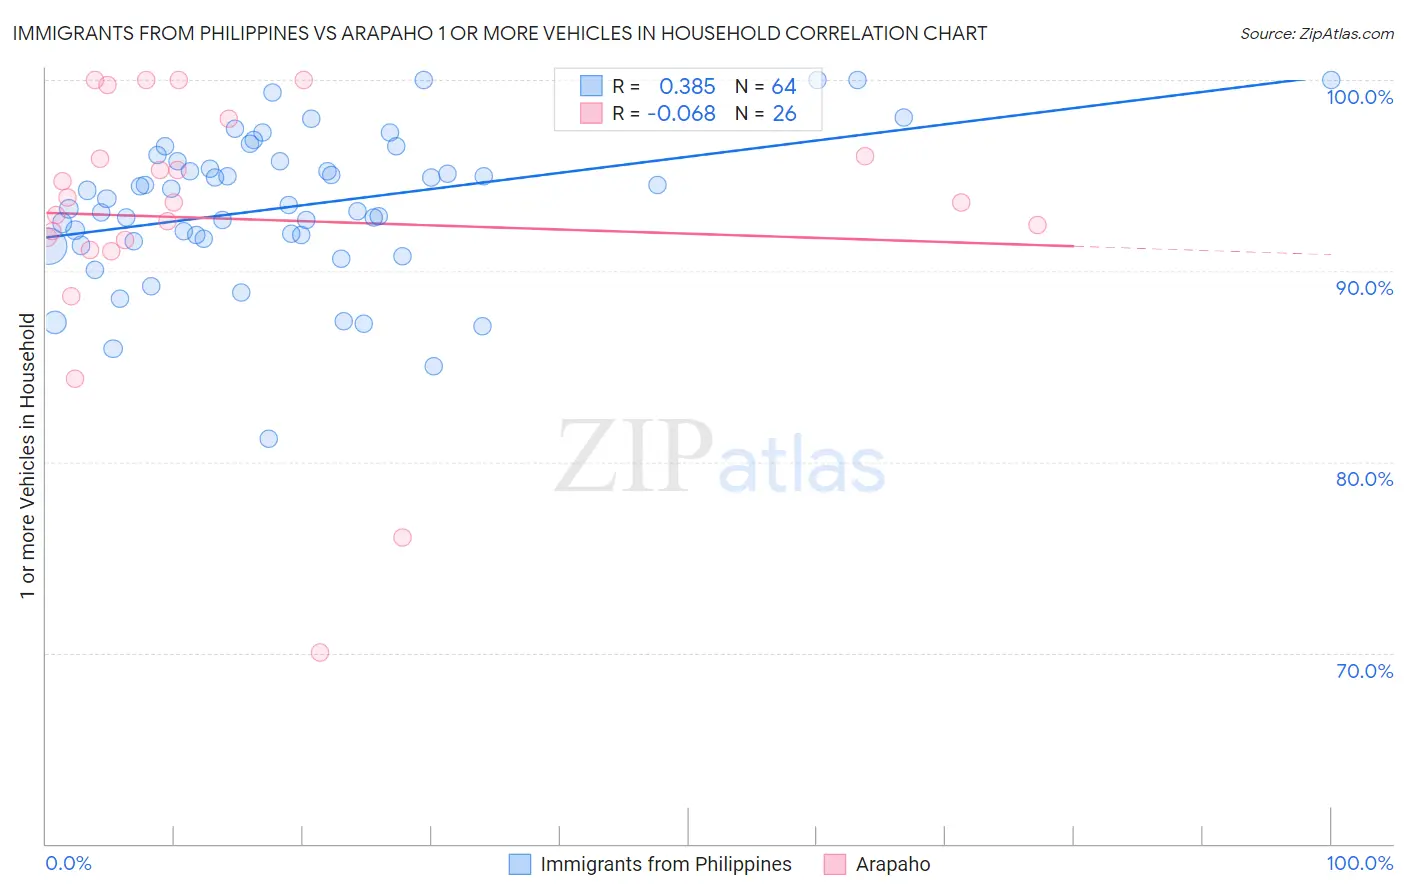
Immigrants from Philippines vs Arapaho 1 or more Vehicles in Household Correlation Chart
The statistical analysis conducted on geographies consisting of 471,073,729 people shows a mild positive correlation between the proportion of Immigrants from Philippines and percentage of households with 1 or more vehicles available in the United States with a correlation coefficient (R) of 0.385 and weighted average of 91.5%. Similarly, the statistical analysis conducted on geographies consisting of 29,777,132 people shows a slight negative correlation between the proportion of Arapaho and percentage of households with 1 or more vehicles available in the United States with a correlation coefficient (R) of -0.068 and weighted average of 92.7%, a difference of 1.3%.
1 or more Vehicles in Household Correlation Summary
| Measurement | Immigrants from Philippines | Arapaho |
| Minimum | 81.2% | 70.0% |
| Maximum | 100.0% | 100.0% |
| Range | 18.8% | 30.0% |
| Mean | 93.4% | 92.7% |
| Median | 93.6% | 93.6% |
| Interquartile 25% (IQ1) | 91.6% | 91.6% |
| Interquartile 75% (IQ3) | 95.7% | 96.0% |
| Interquartile Range (IQR) | 4.1% | 4.4% |
| Standard Deviation (Sample) | 3.8% | 7.0% |
| Standard Deviation (Population) | 3.8% | 6.8% |
Similar Demographics by 1 or more Vehicles in Household
Demographics Similar to Immigrants from Philippines by 1 or more Vehicles in Household
In terms of 1 or more vehicles in household, the demographic groups most similar to Immigrants from Philippines are Iranian (91.5%, a difference of 0.0%), Immigrants from South Central Asia (91.5%, a difference of 0.020%), Bolivian (91.5%, a difference of 0.030%), Cuban (91.5%, a difference of 0.040%), and Portuguese (91.6%, a difference of 0.060%).
| Demographics | Rating | Rank | 1 or more Vehicles in Household |
| Lithuanians | 99.7 /100 | #70 | Exceptional 91.7% |
| Poles | 99.7 /100 | #71 | Exceptional 91.7% |
| Cajuns | 99.7 /100 | #72 | Exceptional 91.7% |
| Immigrants | Iran | 99.7 /100 | #73 | Exceptional 91.7% |
| Immigrants | Lebanon | 99.6 /100 | #74 | Exceptional 91.6% |
| Portuguese | 99.5 /100 | #75 | Exceptional 91.6% |
| Cubans | 99.5 /100 | #76 | Exceptional 91.5% |
| Immigrants | Philippines | 99.4 /100 | #77 | Exceptional 91.5% |
| Iranians | 99.4 /100 | #78 | Exceptional 91.5% |
| Immigrants | South Central Asia | 99.4 /100 | #79 | Exceptional 91.5% |
| Bolivians | 99.4 /100 | #80 | Exceptional 91.5% |
| Immigrants | South Eastern Asia | 99.3 /100 | #81 | Exceptional 91.4% |
| Lebanese | 99.3 /100 | #82 | Exceptional 91.4% |
| Immigrants | England | 99.3 /100 | #83 | Exceptional 91.4% |
| Jordanians | 99.3 /100 | #84 | Exceptional 91.4% |
Demographics Similar to Arapaho by 1 or more Vehicles in Household
In terms of 1 or more vehicles in household, the demographic groups most similar to Arapaho are Ottawa (92.7%, a difference of 0.020%), French (92.7%, a difference of 0.030%), Nepalese (92.6%, a difference of 0.10%), Yaqui (92.6%, a difference of 0.16%), and Tongan (92.9%, a difference of 0.17%).
| Demographics | Rating | Rank | 1 or more Vehicles in Household |
| Whites/Caucasians | 100.0 /100 | #13 | Exceptional 93.1% |
| Irish | 100.0 /100 | #14 | Exceptional 93.1% |
| Mexicans | 100.0 /100 | #15 | Exceptional 93.0% |
| Assyrians/Chaldeans/Syriacs | 100.0 /100 | #16 | Exceptional 93.0% |
| Europeans | 100.0 /100 | #17 | Exceptional 93.0% |
| Welsh | 100.0 /100 | #18 | Exceptional 93.0% |
| Tongans | 100.0 /100 | #19 | Exceptional 92.9% |
| Arapaho | 100.0 /100 | #20 | Exceptional 92.7% |
| Ottawa | 100.0 /100 | #21 | Exceptional 92.7% |
| French | 100.0 /100 | #22 | Exceptional 92.7% |
| Nepalese | 100.0 /100 | #23 | Exceptional 92.6% |
| Yaqui | 100.0 /100 | #24 | Exceptional 92.6% |
| Immigrants | Iraq | 100.0 /100 | #25 | Exceptional 92.5% |
| British | 100.0 /100 | #26 | Exceptional 92.5% |
| Americans | 100.0 /100 | #27 | Exceptional 92.5% |