Immigrants from Panama vs Alaska Native 2 or more Vehicles in Household
COMPARE
Immigrants from Panama
Alaska Native
2 or more Vehicles in Household
2 or more Vehicles in Household Comparison
Immigrants from Panama
Alaska Natives
51.1%
2 OR MORE VEHICLES IN HOUSEHOLD
0.0/ 100
METRIC RATING
290th/ 347
METRIC RANK
53.6%
2 OR MORE VEHICLES IN HOUSEHOLD
3.9/ 100
METRIC RATING
228th/ 347
METRIC RANK
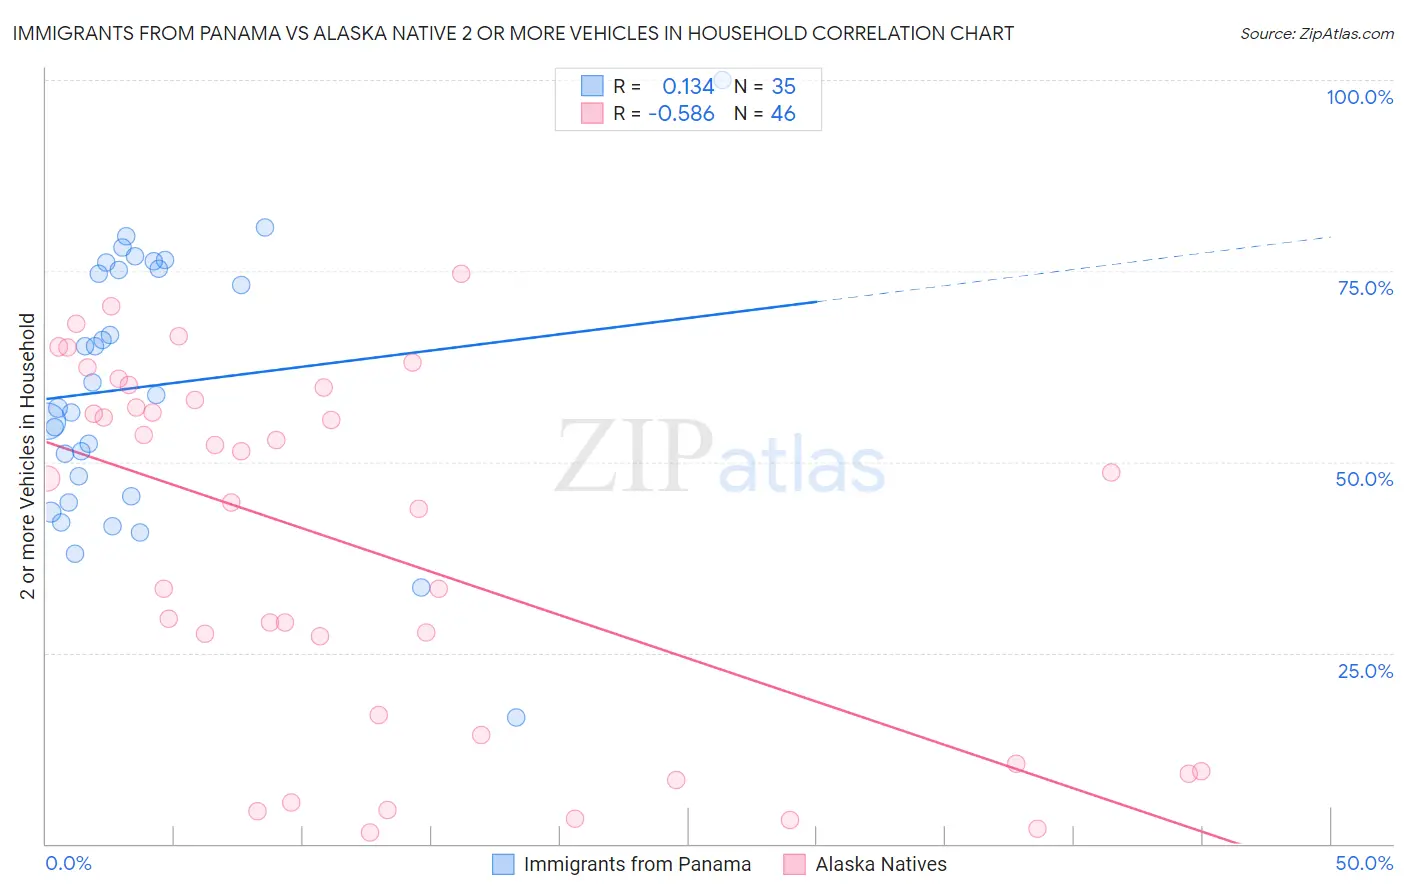
Immigrants from Panama vs Alaska Native 2 or more Vehicles in Household Correlation Chart
The statistical analysis conducted on geographies consisting of 221,156,465 people shows a poor positive correlation between the proportion of Immigrants from Panama and percentage of households with 2 or more vehicles available in the United States with a correlation coefficient (R) of 0.134 and weighted average of 51.1%. Similarly, the statistical analysis conducted on geographies consisting of 76,736,682 people shows a substantial negative correlation between the proportion of Alaska Natives and percentage of households with 2 or more vehicles available in the United States with a correlation coefficient (R) of -0.586 and weighted average of 53.6%, a difference of 4.9%.
2 or more Vehicles in Household Correlation Summary
| Measurement | Immigrants from Panama | Alaska Native |
| Minimum | 16.5% | 1.5% |
| Maximum | 100.0% | 74.6% |
| Range | 83.5% | 73.1% |
| Mean | 59.9% | 38.7% |
| Median | 58.8% | 46.2% |
| Interquartile 25% (IQ1) | 45.5% | 14.3% |
| Interquartile 75% (IQ3) | 75.3% | 58.0% |
| Interquartile Range (IQR) | 29.8% | 43.8% |
| Standard Deviation (Sample) | 17.2% | 23.4% |
| Standard Deviation (Population) | 16.9% | 23.2% |
Similar Demographics by 2 or more Vehicles in Household
Demographics Similar to Immigrants from Panama by 2 or more Vehicles in Household
In terms of 2 or more vehicles in household, the demographic groups most similar to Immigrants from Panama are Belizean (51.0%, a difference of 0.030%), Somali (51.1%, a difference of 0.060%), Okinawan (51.2%, a difference of 0.35%), Immigrants from Ukraine (50.9%, a difference of 0.36%), and Black/African American (50.9%, a difference of 0.37%).
| Demographics | Rating | Rank | 2 or more Vehicles in Household |
| Immigrants | China | 0.1 /100 | #283 | Tragic 51.5% |
| Immigrants | Zaire | 0.1 /100 | #284 | Tragic 51.5% |
| Immigrants | Uruguay | 0.1 /100 | #285 | Tragic 51.4% |
| Immigrants | Liberia | 0.1 /100 | #286 | Tragic 51.3% |
| Immigrants | Serbia | 0.1 /100 | #287 | Tragic 51.3% |
| Okinawans | 0.1 /100 | #288 | Tragic 51.2% |
| Somalis | 0.0 /100 | #289 | Tragic 51.1% |
| Immigrants | Panama | 0.0 /100 | #290 | Tragic 51.1% |
| Belizeans | 0.0 /100 | #291 | Tragic 51.0% |
| Immigrants | Ukraine | 0.0 /100 | #292 | Tragic 50.9% |
| Blacks/African Americans | 0.0 /100 | #293 | Tragic 50.9% |
| Bermudans | 0.0 /100 | #294 | Tragic 50.6% |
| Cypriots | 0.0 /100 | #295 | Tragic 50.6% |
| Immigrants | Somalia | 0.0 /100 | #296 | Tragic 50.5% |
| Immigrants | Spain | 0.0 /100 | #297 | Tragic 50.4% |
Demographics Similar to Alaska Natives by 2 or more Vehicles in Household
In terms of 2 or more vehicles in household, the demographic groups most similar to Alaska Natives are Immigrants from Turkey (53.6%, a difference of 0.020%), Sudanese (53.6%, a difference of 0.060%), Immigrants from Nepal (53.5%, a difference of 0.080%), Panamanian (53.5%, a difference of 0.13%), and Immigrants from Guatemala (53.5%, a difference of 0.20%).
| Demographics | Rating | Rank | 2 or more Vehicles in Household |
| Immigrants | Singapore | 6.3 /100 | #221 | Tragic 53.9% |
| Kiowa | 6.2 /100 | #222 | Tragic 53.9% |
| Immigrants | Bosnia and Herzegovina | 5.5 /100 | #223 | Tragic 53.8% |
| Brazilians | 5.3 /100 | #224 | Tragic 53.8% |
| Immigrants | Egypt | 5.2 /100 | #225 | Tragic 53.8% |
| Immigrants | Eastern Africa | 5.1 /100 | #226 | Tragic 53.7% |
| Sudanese | 4.1 /100 | #227 | Tragic 53.6% |
| Alaska Natives | 3.9 /100 | #228 | Tragic 53.6% |
| Immigrants | Turkey | 3.8 /100 | #229 | Tragic 53.6% |
| Immigrants | Nepal | 3.6 /100 | #230 | Tragic 53.5% |
| Panamanians | 3.4 /100 | #231 | Tragic 53.5% |
| Immigrants | Guatemala | 3.2 /100 | #232 | Tragic 53.5% |
| Ugandans | 3.2 /100 | #233 | Tragic 53.5% |
| Immigrants | Switzerland | 3.0 /100 | #234 | Tragic 53.4% |
| Immigrants | Middle Africa | 3.0 /100 | #235 | Tragic 53.4% |