Immigrants from North Macedonia vs Immigrants from Morocco 1 or more Vehicles in Household
COMPARE
Immigrants from North Macedonia
Immigrants from Morocco
1 or more Vehicles in Household
1 or more Vehicles in Household Comparison
Immigrants from North Macedonia
Immigrants from Morocco
89.5%
1 OR MORE VEHICLES IN HOUSEHOLD
36.5/ 100
METRIC RATING
192nd/ 347
METRIC RANK
87.4%
1 OR MORE VEHICLES IN HOUSEHOLD
0.1/ 100
METRIC RATING
274th/ 347
METRIC RANK
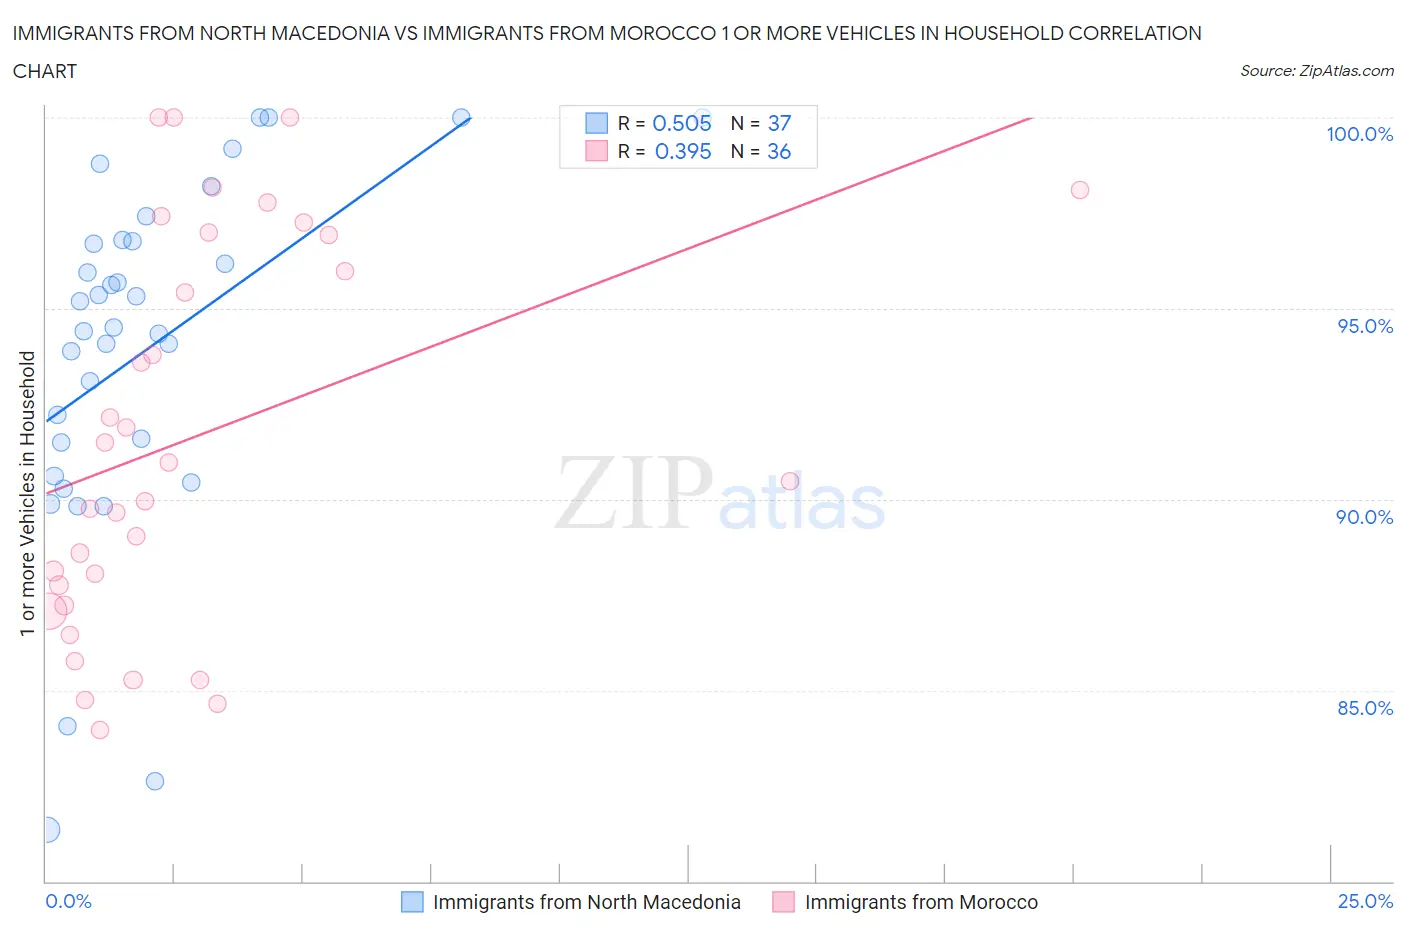
Immigrants from North Macedonia vs Immigrants from Morocco 1 or more Vehicles in Household Correlation Chart
The statistical analysis conducted on geographies consisting of 74,050,012 people shows a substantial positive correlation between the proportion of Immigrants from North Macedonia and percentage of households with 1 or more vehicles available in the United States with a correlation coefficient (R) of 0.505 and weighted average of 89.5%. Similarly, the statistical analysis conducted on geographies consisting of 178,835,881 people shows a mild positive correlation between the proportion of Immigrants from Morocco and percentage of households with 1 or more vehicles available in the United States with a correlation coefficient (R) of 0.395 and weighted average of 87.4%, a difference of 2.4%.
1 or more Vehicles in Household Correlation Summary
| Measurement | Immigrants from North Macedonia | Immigrants from Morocco |
| Minimum | 81.4% | 84.0% |
| Maximum | 100.0% | 100.0% |
| Range | 18.6% | 16.0% |
| Mean | 93.9% | 91.7% |
| Median | 94.5% | 90.7% |
| Interquartile 25% (IQ1) | 91.1% | 87.5% |
| Interquartile 75% (IQ3) | 96.8% | 96.9% |
| Interquartile Range (IQR) | 5.7% | 9.5% |
| Standard Deviation (Sample) | 4.6% | 5.1% |
| Standard Deviation (Population) | 4.5% | 5.0% |
Similar Demographics by 1 or more Vehicles in Household
Demographics Similar to Immigrants from North Macedonia by 1 or more Vehicles in Household
In terms of 1 or more vehicles in household, the demographic groups most similar to Immigrants from North Macedonia are Immigrants from Poland (89.5%, a difference of 0.010%), Carpatho Rusyn (89.5%, a difference of 0.020%), Shoshone (89.5%, a difference of 0.020%), Immigrants from Northern Europe (89.5%, a difference of 0.020%), and Immigrants from Nepal (89.5%, a difference of 0.040%).
| Demographics | Rating | Rank | 1 or more Vehicles in Household |
| Immigrants | Brazil | 40.1 /100 | #185 | Average 89.6% |
| Pueblo | 39.9 /100 | #186 | Fair 89.6% |
| South Americans | 39.6 /100 | #187 | Fair 89.5% |
| Immigrants | Nepal | 38.9 /100 | #188 | Fair 89.5% |
| Carpatho Rusyns | 37.8 /100 | #189 | Fair 89.5% |
| Shoshone | 37.5 /100 | #190 | Fair 89.5% |
| Immigrants | Poland | 37.1 /100 | #191 | Fair 89.5% |
| Immigrants | North Macedonia | 36.5 /100 | #192 | Fair 89.5% |
| Immigrants | Northern Europe | 35.5 /100 | #193 | Fair 89.5% |
| Immigrants | Eritrea | 33.2 /100 | #194 | Fair 89.4% |
| Immigrants | Armenia | 31.8 /100 | #195 | Fair 89.4% |
| Crow | 24.3 /100 | #196 | Fair 89.3% |
| Immigrants | Sweden | 23.6 /100 | #197 | Fair 89.3% |
| Pennsylvania Germans | 22.9 /100 | #198 | Fair 89.3% |
| Immigrants | Asia | 22.8 /100 | #199 | Fair 89.3% |
Demographics Similar to Immigrants from Morocco by 1 or more Vehicles in Household
In terms of 1 or more vehicles in household, the demographic groups most similar to Immigrants from Morocco are Immigrants from Northern Africa (87.4%, a difference of 0.030%), Aleut (87.5%, a difference of 0.080%), Bermudan (87.5%, a difference of 0.14%), Panamanian (87.5%, a difference of 0.15%), and Immigrants from Africa (87.6%, a difference of 0.16%).
| Demographics | Rating | Rank | 1 or more Vehicles in Household |
| Immigrants | Colombia | 0.3 /100 | #267 | Tragic 87.6% |
| Immigrants | Europe | 0.2 /100 | #268 | Tragic 87.6% |
| Immigrants | Africa | 0.2 /100 | #269 | Tragic 87.6% |
| Panamanians | 0.2 /100 | #270 | Tragic 87.5% |
| Bermudans | 0.2 /100 | #271 | Tragic 87.5% |
| Aleuts | 0.2 /100 | #272 | Tragic 87.5% |
| Immigrants | Northern Africa | 0.2 /100 | #273 | Tragic 87.4% |
| Immigrants | Morocco | 0.1 /100 | #274 | Tragic 87.4% |
| Immigrants | Singapore | 0.1 /100 | #275 | Tragic 87.2% |
| Immigrants | France | 0.1 /100 | #276 | Tragic 87.1% |
| Alsatians | 0.1 /100 | #277 | Tragic 87.1% |
| Immigrants | Southern Europe | 0.1 /100 | #278 | Tragic 87.1% |
| Immigrants | Albania | 0.1 /100 | #279 | Tragic 87.1% |
| Immigrants | Croatia | 0.0 /100 | #280 | Tragic 87.0% |
| Mongolians | 0.0 /100 | #281 | Tragic 87.0% |