Venezuelan vs Immigrants from Morocco 1 or more Vehicles in Household
COMPARE
Venezuelan
Immigrants from Morocco
1 or more Vehicles in Household
1 or more Vehicles in Household Comparison
Venezuelans
Immigrants from Morocco
91.9%
1 OR MORE VEHICLES IN HOUSEHOLD
99.8/ 100
METRIC RATING
59th/ 347
METRIC RANK
87.4%
1 OR MORE VEHICLES IN HOUSEHOLD
0.1/ 100
METRIC RATING
274th/ 347
METRIC RANK
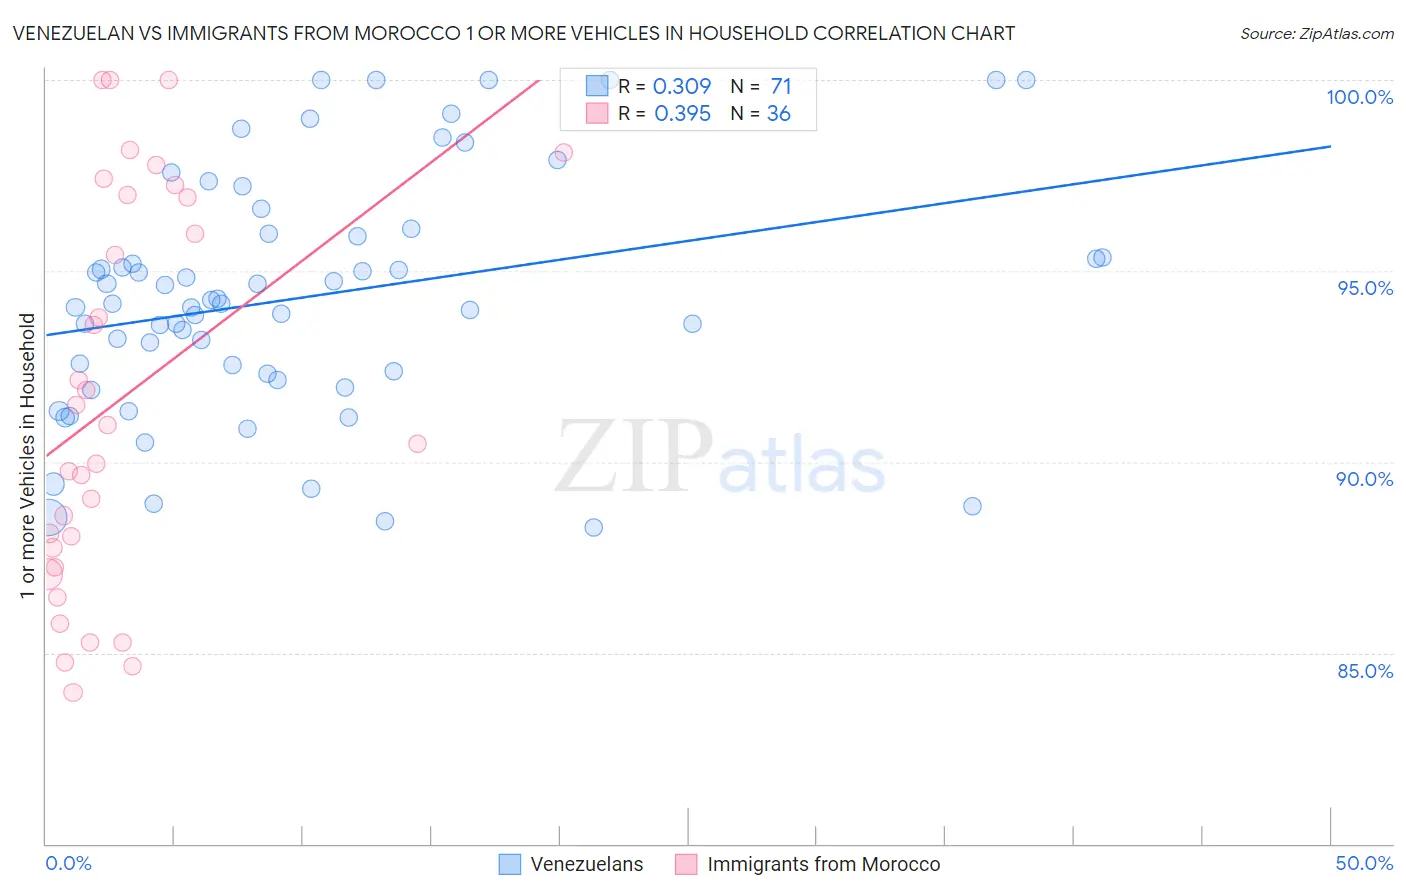
Venezuelan vs Immigrants from Morocco 1 or more Vehicles in Household Correlation Chart
The statistical analysis conducted on geographies consisting of 306,174,989 people shows a mild positive correlation between the proportion of Venezuelans and percentage of households with 1 or more vehicles available in the United States with a correlation coefficient (R) of 0.309 and weighted average of 91.9%. Similarly, the statistical analysis conducted on geographies consisting of 178,835,881 people shows a mild positive correlation between the proportion of Immigrants from Morocco and percentage of households with 1 or more vehicles available in the United States with a correlation coefficient (R) of 0.395 and weighted average of 87.4%, a difference of 5.1%.
1 or more Vehicles in Household Correlation Summary
| Measurement | Venezuelan | Immigrants from Morocco |
| Minimum | 88.3% | 84.0% |
| Maximum | 100.0% | 100.0% |
| Range | 11.7% | 16.0% |
| Mean | 94.3% | 91.7% |
| Median | 94.2% | 90.7% |
| Interquartile 25% (IQ1) | 92.3% | 87.5% |
| Interquartile 75% (IQ3) | 96.0% | 96.9% |
| Interquartile Range (IQR) | 3.7% | 9.5% |
| Standard Deviation (Sample) | 3.1% | 5.1% |
| Standard Deviation (Population) | 3.1% | 5.0% |
Similar Demographics by 1 or more Vehicles in Household
Demographics Similar to Venezuelans by 1 or more Vehicles in Household
In terms of 1 or more vehicles in household, the demographic groups most similar to Venezuelans are Immigrants from Mexico (91.9%, a difference of 0.010%), Iraqi (91.9%, a difference of 0.030%), Slovak (91.9%, a difference of 0.030%), Immigrants from India (91.9%, a difference of 0.040%), and Thai (91.9%, a difference of 0.040%).
| Demographics | Rating | Rank | 1 or more Vehicles in Household |
| Koreans | 99.9 /100 | #52 | Exceptional 92.1% |
| Hawaiians | 99.9 /100 | #53 | Exceptional 92.0% |
| Slovenes | 99.9 /100 | #54 | Exceptional 92.0% |
| Immigrants | Afghanistan | 99.9 /100 | #55 | Exceptional 92.0% |
| Immigrants | Venezuela | 99.9 /100 | #56 | Exceptional 92.0% |
| Iraqis | 99.8 /100 | #57 | Exceptional 91.9% |
| Immigrants | Mexico | 99.8 /100 | #58 | Exceptional 91.9% |
| Venezuelans | 99.8 /100 | #59 | Exceptional 91.9% |
| Slovaks | 99.8 /100 | #60 | Exceptional 91.9% |
| Immigrants | India | 99.8 /100 | #61 | Exceptional 91.9% |
| Thais | 99.8 /100 | #62 | Exceptional 91.9% |
| Chinese | 99.8 /100 | #63 | Exceptional 91.9% |
| Croatians | 99.8 /100 | #64 | Exceptional 91.9% |
| Immigrants | Laos | 99.8 /100 | #65 | Exceptional 91.8% |
| Canadians | 99.8 /100 | #66 | Exceptional 91.8% |
Demographics Similar to Immigrants from Morocco by 1 or more Vehicles in Household
In terms of 1 or more vehicles in household, the demographic groups most similar to Immigrants from Morocco are Immigrants from Northern Africa (87.4%, a difference of 0.030%), Aleut (87.5%, a difference of 0.080%), Bermudan (87.5%, a difference of 0.14%), Panamanian (87.5%, a difference of 0.15%), and Immigrants from Africa (87.6%, a difference of 0.16%).
| Demographics | Rating | Rank | 1 or more Vehicles in Household |
| Immigrants | Colombia | 0.3 /100 | #267 | Tragic 87.6% |
| Immigrants | Europe | 0.2 /100 | #268 | Tragic 87.6% |
| Immigrants | Africa | 0.2 /100 | #269 | Tragic 87.6% |
| Panamanians | 0.2 /100 | #270 | Tragic 87.5% |
| Bermudans | 0.2 /100 | #271 | Tragic 87.5% |
| Aleuts | 0.2 /100 | #272 | Tragic 87.5% |
| Immigrants | Northern Africa | 0.2 /100 | #273 | Tragic 87.4% |
| Immigrants | Morocco | 0.1 /100 | #274 | Tragic 87.4% |
| Immigrants | Singapore | 0.1 /100 | #275 | Tragic 87.2% |
| Immigrants | France | 0.1 /100 | #276 | Tragic 87.1% |
| Alsatians | 0.1 /100 | #277 | Tragic 87.1% |
| Immigrants | Southern Europe | 0.1 /100 | #278 | Tragic 87.1% |
| Immigrants | Albania | 0.1 /100 | #279 | Tragic 87.1% |
| Immigrants | Croatia | 0.0 /100 | #280 | Tragic 87.0% |
| Mongolians | 0.0 /100 | #281 | Tragic 87.0% |