Immigrants from Nigeria vs Belizean Disability Age 18 to 34
COMPARE
Immigrants from Nigeria
Belizean
Disability Age 18 to 34
Disability Age 18 to 34 Comparison
Immigrants from Nigeria
Belizeans
6.5%
DISABILITY AGE 18 TO 34
70.4/ 100
METRIC RATING
164th/ 347
METRIC RANK
6.4%
DISABILITY AGE 18 TO 34
84.9/ 100
METRIC RATING
146th/ 347
METRIC RANK
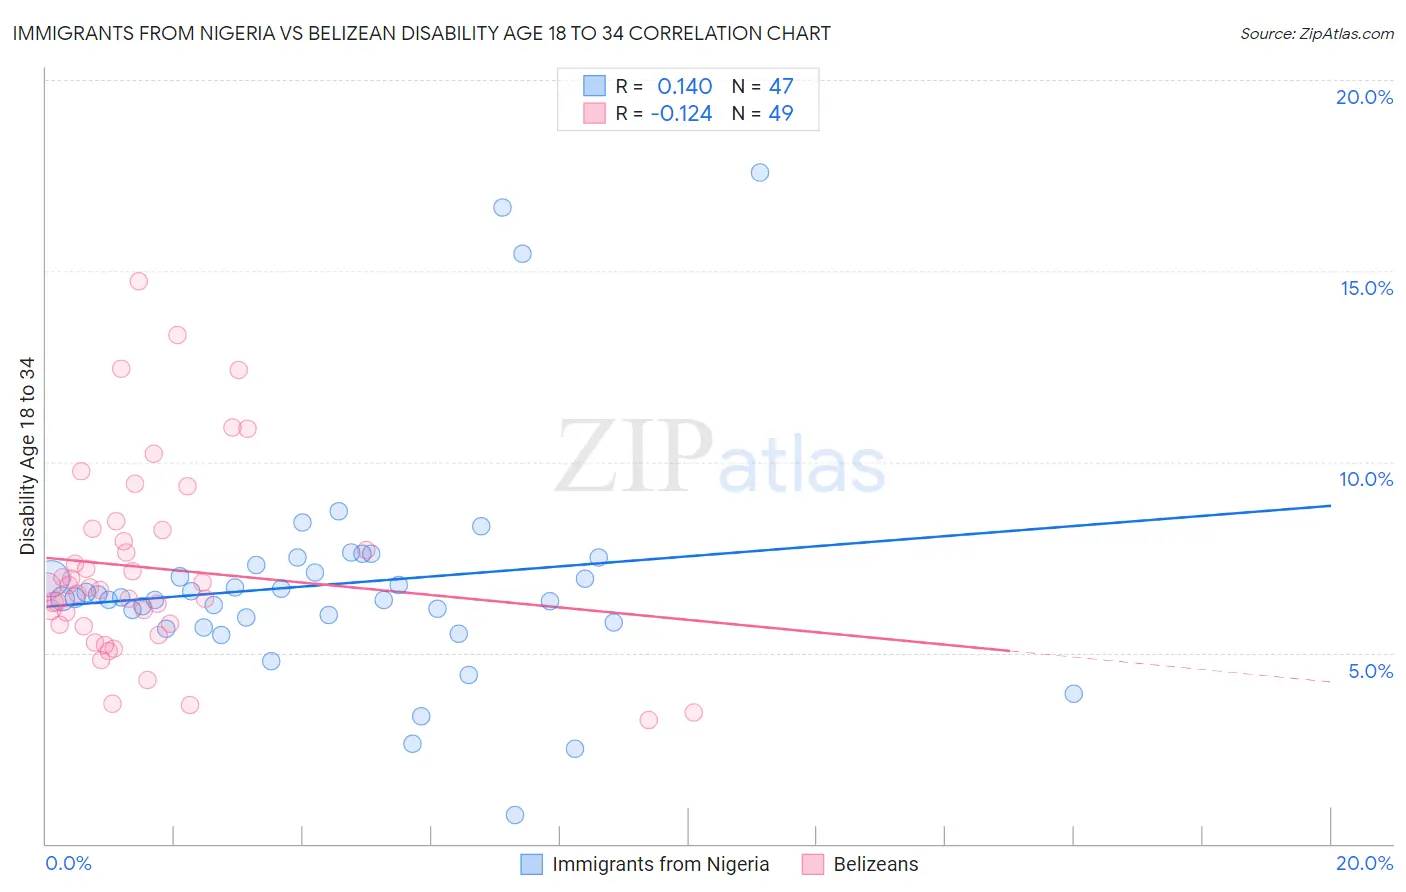
Immigrants from Nigeria vs Belizean Disability Age 18 to 34 Correlation Chart
The statistical analysis conducted on geographies consisting of 283,280,225 people shows a poor positive correlation between the proportion of Immigrants from Nigeria and percentage of population with a disability between the ages 18 and 35 in the United States with a correlation coefficient (R) of 0.140 and weighted average of 6.5%. Similarly, the statistical analysis conducted on geographies consisting of 144,092,857 people shows a poor negative correlation between the proportion of Belizeans and percentage of population with a disability between the ages 18 and 35 in the United States with a correlation coefficient (R) of -0.124 and weighted average of 6.4%, a difference of 1.5%.
Disability Age 18 to 34 Correlation Summary
| Measurement | Immigrants from Nigeria | Belizean |
| Minimum | 0.76% | 3.2% |
| Maximum | 17.6% | 14.7% |
| Range | 16.8% | 11.5% |
| Mean | 6.8% | 7.2% |
| Median | 6.5% | 6.7% |
| Interquartile 25% (IQ1) | 5.8% | 5.7% |
| Interquartile 75% (IQ3) | 7.3% | 8.2% |
| Interquartile Range (IQR) | 1.5% | 2.5% |
| Standard Deviation (Sample) | 3.0% | 2.5% |
| Standard Deviation (Population) | 3.0% | 2.5% |
Demographics Similar to Immigrants from Nigeria and Belizeans by Disability Age 18 to 34
In terms of disability age 18 to 34, the demographic groups most similar to Immigrants from Nigeria are Immigrants from Hungary (6.5%, a difference of 0.060%), South African (6.5%, a difference of 0.11%), Immigrants from Denmark (6.5%, a difference of 0.11%), Arab (6.5%, a difference of 0.17%), and Immigrants from Southern Europe (6.5%, a difference of 0.19%). Similarly, the demographic groups most similar to Belizeans are Moroccan (6.4%, a difference of 0.050%), Immigrants from South Africa (6.4%, a difference of 0.16%), Immigrants from Belgium (6.4%, a difference of 0.18%), Honduran (6.4%, a difference of 0.24%), and Immigrants from Dominican Republic (6.4%, a difference of 0.28%).
| Demographics | Rating | Rank | Disability Age 18 to 34 |
| Moroccans | 85.2 /100 | #145 | Excellent 6.4% |
| Belizeans | 84.9 /100 | #146 | Excellent 6.4% |
| Immigrants | South Africa | 83.7 /100 | #147 | Excellent 6.4% |
| Immigrants | Belgium | 83.5 /100 | #148 | Excellent 6.4% |
| Hondurans | 83.1 /100 | #149 | Excellent 6.4% |
| Immigrants | Dominican Republic | 82.7 /100 | #150 | Excellent 6.4% |
| Tongans | 81.9 /100 | #151 | Excellent 6.4% |
| Bulgarians | 78.3 /100 | #152 | Good 6.5% |
| Immigrants | Eritrea | 77.4 /100 | #153 | Good 6.5% |
| Immigrants | Central America | 76.8 /100 | #154 | Good 6.5% |
| Inupiat | 76.7 /100 | #155 | Good 6.5% |
| Immigrants | Panama | 75.3 /100 | #156 | Good 6.5% |
| Immigrants | Sierra Leone | 75.0 /100 | #157 | Good 6.5% |
| Zimbabweans | 74.7 /100 | #158 | Good 6.5% |
| Dominicans | 73.6 /100 | #159 | Good 6.5% |
| Immigrants | Southern Europe | 72.5 /100 | #160 | Good 6.5% |
| Arabs | 72.3 /100 | #161 | Good 6.5% |
| South Africans | 71.7 /100 | #162 | Good 6.5% |
| Immigrants | Denmark | 71.7 /100 | #163 | Good 6.5% |
| Immigrants | Nigeria | 70.4 /100 | #164 | Good 6.5% |
| Immigrants | Hungary | 69.6 /100 | #165 | Good 6.5% |