Immigrants from Nigeria vs Cree 1 or more Vehicles in Household
COMPARE
Immigrants from Nigeria
Cree
1 or more Vehicles in Household
1 or more Vehicles in Household Comparison
Immigrants from Nigeria
Cree
88.2%
1 OR MORE VEHICLES IN HOUSEHOLD
1.5/ 100
METRIC RATING
248th/ 347
METRIC RANK
88.7%
1 OR MORE VEHICLES IN HOUSEHOLD
6.0/ 100
METRIC RATING
225th/ 347
METRIC RANK
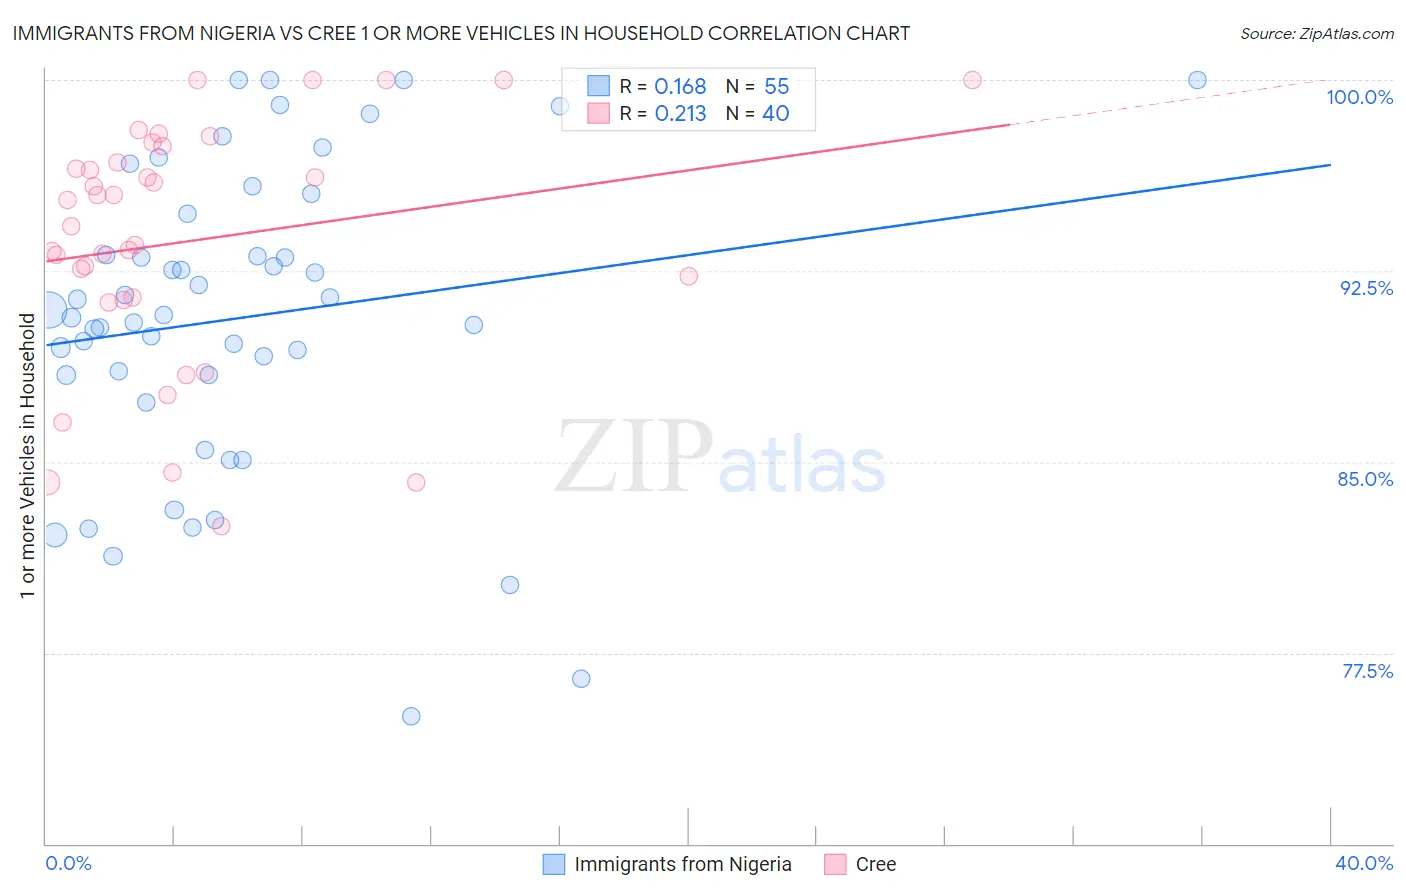
Immigrants from Nigeria vs Cree 1 or more Vehicles in Household Correlation Chart
The statistical analysis conducted on geographies consisting of 283,317,819 people shows a poor positive correlation between the proportion of Immigrants from Nigeria and percentage of households with 1 or more vehicles available in the United States with a correlation coefficient (R) of 0.168 and weighted average of 88.2%. Similarly, the statistical analysis conducted on geographies consisting of 76,210,304 people shows a weak positive correlation between the proportion of Cree and percentage of households with 1 or more vehicles available in the United States with a correlation coefficient (R) of 0.213 and weighted average of 88.7%, a difference of 0.56%.
1 or more Vehicles in Household Correlation Summary
| Measurement | Immigrants from Nigeria | Cree |
| Minimum | 75.0% | 82.5% |
| Maximum | 100.0% | 100.0% |
| Range | 25.0% | 17.5% |
| Mean | 90.6% | 93.7% |
| Median | 90.8% | 94.8% |
| Interquartile 25% (IQ1) | 88.4% | 91.4% |
| Interquartile 75% (IQ3) | 94.7% | 97.1% |
| Interquartile Range (IQR) | 6.3% | 5.7% |
| Standard Deviation (Sample) | 6.0% | 4.8% |
| Standard Deviation (Population) | 5.9% | 4.7% |
Similar Demographics by 1 or more Vehicles in Household
Demographics Similar to Immigrants from Nigeria by 1 or more Vehicles in Household
In terms of 1 or more vehicles in household, the demographic groups most similar to Immigrants from Nigeria are Immigrants from Honduras (88.3%, a difference of 0.050%), Black/African American (88.2%, a difference of 0.050%), Menominee (88.3%, a difference of 0.080%), Immigrants from Czechoslovakia (88.3%, a difference of 0.090%), and Egyptian (88.2%, a difference of 0.090%).
| Demographics | Rating | Rank | 1 or more Vehicles in Household |
| Taiwanese | 2.6 /100 | #241 | Tragic 88.4% |
| Turks | 2.5 /100 | #242 | Tragic 88.4% |
| Immigrants | Belgium | 2.1 /100 | #243 | Tragic 88.4% |
| Immigrants | Portugal | 2.0 /100 | #244 | Tragic 88.3% |
| Immigrants | Czechoslovakia | 1.9 /100 | #245 | Tragic 88.3% |
| Menominee | 1.9 /100 | #246 | Tragic 88.3% |
| Immigrants | Honduras | 1.7 /100 | #247 | Tragic 88.3% |
| Immigrants | Nigeria | 1.5 /100 | #248 | Tragic 88.2% |
| Blacks/African Americans | 1.4 /100 | #249 | Tragic 88.2% |
| Egyptians | 1.2 /100 | #250 | Tragic 88.2% |
| Immigrants | Serbia | 1.2 /100 | #251 | Tragic 88.2% |
| Immigrants | Uruguay | 1.1 /100 | #252 | Tragic 88.1% |
| Hondurans | 1.0 /100 | #253 | Tragic 88.1% |
| Haitians | 0.9 /100 | #254 | Tragic 88.1% |
| Immigrants | Latvia | 0.9 /100 | #255 | Tragic 88.1% |
Demographics Similar to Cree by 1 or more Vehicles in Household
In terms of 1 or more vehicles in household, the demographic groups most similar to Cree are Immigrants from Hong Kong (88.7%, a difference of 0.010%), Cheyenne (88.7%, a difference of 0.030%), Ute (88.7%, a difference of 0.030%), Immigrants from Norway (88.7%, a difference of 0.040%), and Immigrants from Romania (88.7%, a difference of 0.050%).
| Demographics | Rating | Rank | 1 or more Vehicles in Household |
| Ugandans | 8.7 /100 | #218 | Tragic 88.9% |
| Immigrants | Guatemala | 8.6 /100 | #219 | Tragic 88.9% |
| Immigrants | Zaire | 8.1 /100 | #220 | Tragic 88.8% |
| Peruvians | 7.9 /100 | #221 | Tragic 88.8% |
| Uruguayans | 7.0 /100 | #222 | Tragic 88.8% |
| Immigrants | South America | 7.0 /100 | #223 | Tragic 88.8% |
| Immigrants | Hong Kong | 6.2 /100 | #224 | Tragic 88.7% |
| Cree | 6.0 /100 | #225 | Tragic 88.7% |
| Cheyenne | 5.7 /100 | #226 | Tragic 88.7% |
| Ute | 5.6 /100 | #227 | Tragic 88.7% |
| Immigrants | Norway | 5.5 /100 | #228 | Tragic 88.7% |
| Immigrants | Romania | 5.4 /100 | #229 | Tragic 88.7% |
| Immigrants | Sierra Leone | 5.2 /100 | #230 | Tragic 88.7% |
| Russians | 5.0 /100 | #231 | Tragic 88.7% |
| Immigrants | Japan | 4.9 /100 | #232 | Tragic 88.7% |