Immigrants from Nicaragua vs Immigrants from Spain 1 or more Vehicles in Household
COMPARE
Immigrants from Nicaragua
Immigrants from Spain
1 or more Vehicles in Household
1 or more Vehicles in Household Comparison
Immigrants from Nicaragua
Immigrants from Spain
90.1%
1 OR MORE VEHICLES IN HOUSEHOLD
76.7/ 100
METRIC RATING
149th/ 347
METRIC RANK
85.8%
1 OR MORE VEHICLES IN HOUSEHOLD
0.0/ 100
METRIC RATING
296th/ 347
METRIC RANK
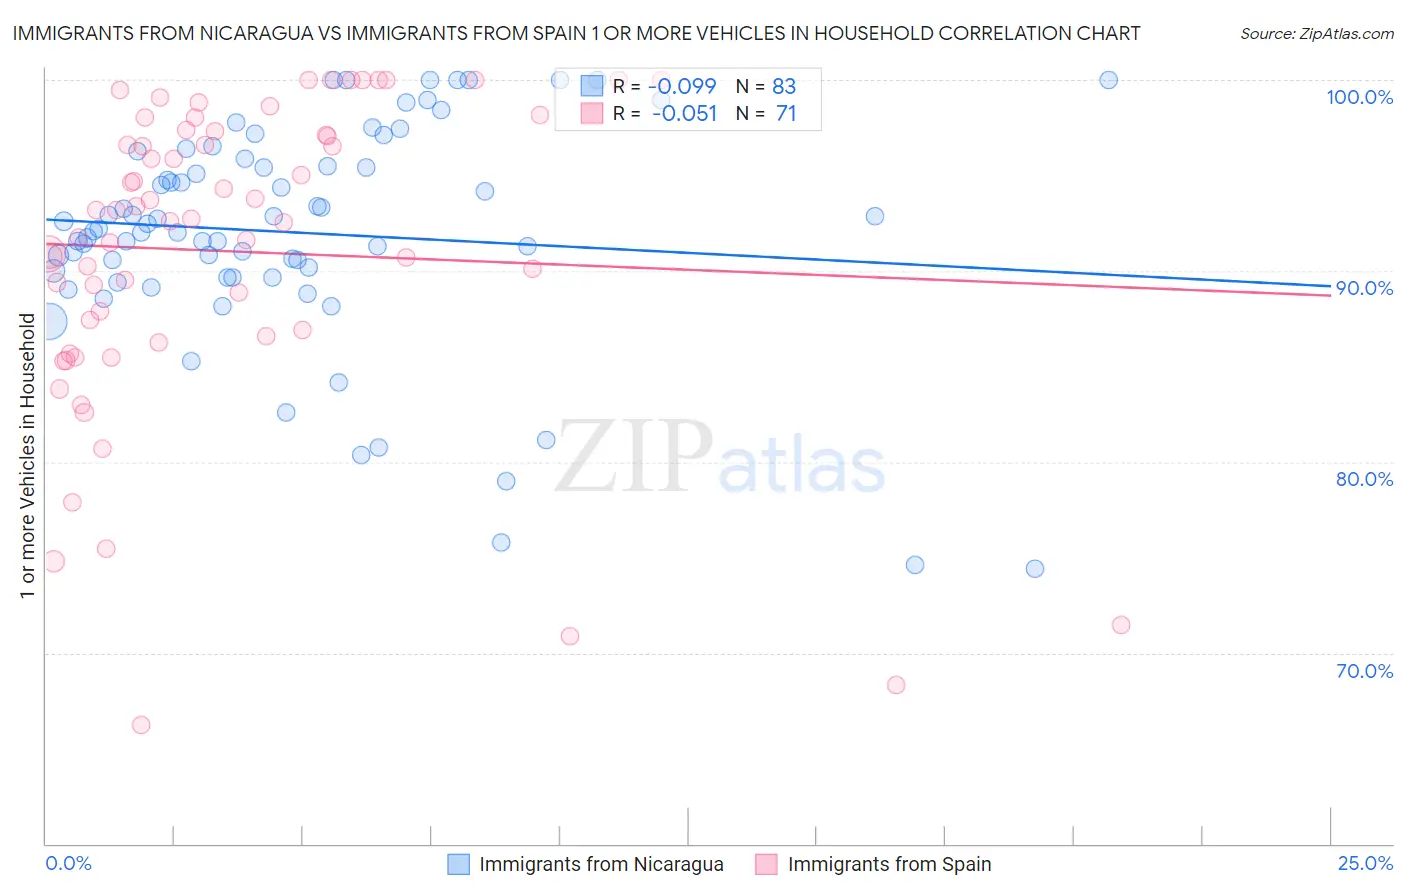
Immigrants from Nicaragua vs Immigrants from Spain 1 or more Vehicles in Household Correlation Chart
The statistical analysis conducted on geographies consisting of 236,317,806 people shows a slight negative correlation between the proportion of Immigrants from Nicaragua and percentage of households with 1 or more vehicles available in the United States with a correlation coefficient (R) of -0.099 and weighted average of 90.1%. Similarly, the statistical analysis conducted on geographies consisting of 239,528,029 people shows a slight negative correlation between the proportion of Immigrants from Spain and percentage of households with 1 or more vehicles available in the United States with a correlation coefficient (R) of -0.051 and weighted average of 85.8%, a difference of 5.0%.
1 or more Vehicles in Household Correlation Summary
| Measurement | Immigrants from Nicaragua | Immigrants from Spain |
| Minimum | 74.4% | 66.2% |
| Maximum | 100.0% | 100.0% |
| Range | 25.6% | 33.8% |
| Mean | 92.0% | 91.0% |
| Median | 92.2% | 92.8% |
| Interquartile 25% (IQ1) | 89.7% | 86.6% |
| Interquartile 75% (IQ3) | 95.9% | 97.3% |
| Interquartile Range (IQR) | 6.2% | 10.8% |
| Standard Deviation (Sample) | 5.8% | 8.2% |
| Standard Deviation (Population) | 5.8% | 8.1% |
Similar Demographics by 1 or more Vehicles in Household
Demographics Similar to Immigrants from Nicaragua by 1 or more Vehicles in Household
In terms of 1 or more vehicles in household, the demographic groups most similar to Immigrants from Nicaragua are Immigrants from Micronesia (90.1%, a difference of 0.020%), Immigrants from Eastern Africa (90.1%, a difference of 0.030%), Immigrants from Bosnia and Herzegovina (90.1%, a difference of 0.030%), Tlingit-Haida (90.1%, a difference of 0.050%), and New Zealander (90.1%, a difference of 0.060%).
| Demographics | Rating | Rank | 1 or more Vehicles in Household |
| Immigrants | Lithuania | 83.0 /100 | #142 | Excellent 90.2% |
| Immigrants | Bahamas | 81.5 /100 | #143 | Excellent 90.2% |
| Immigrants | Zimbabwe | 81.5 /100 | #144 | Excellent 90.2% |
| Sioux | 81.3 /100 | #145 | Excellent 90.2% |
| Bahamians | 80.5 /100 | #146 | Excellent 90.2% |
| Chileans | 79.8 /100 | #147 | Good 90.2% |
| Immigrants | Eastern Africa | 78.2 /100 | #148 | Good 90.1% |
| Immigrants | Nicaragua | 76.7 /100 | #149 | Good 90.1% |
| Immigrants | Micronesia | 75.9 /100 | #150 | Good 90.1% |
| Immigrants | Bosnia and Herzegovina | 75.4 /100 | #151 | Good 90.1% |
| Tlingit-Haida | 74.3 /100 | #152 | Good 90.1% |
| New Zealanders | 73.8 /100 | #153 | Good 90.1% |
| Immigrants | Uganda | 73.8 /100 | #154 | Good 90.1% |
| Immigrants | Immigrants | 73.6 /100 | #155 | Good 90.1% |
| Australians | 72.4 /100 | #156 | Good 90.0% |
Demographics Similar to Immigrants from Spain by 1 or more Vehicles in Household
In terms of 1 or more vehicles in household, the demographic groups most similar to Immigrants from Spain are Immigrants from Jamaica (85.8%, a difference of 0.030%), Paraguayan (85.7%, a difference of 0.090%), Belizean (85.7%, a difference of 0.17%), Alaskan Athabascan (86.0%, a difference of 0.20%), and Indian (Asian) (86.0%, a difference of 0.28%).
| Demographics | Rating | Rank | 1 or more Vehicles in Household |
| Immigrants | Ireland | 0.0 /100 | #289 | Tragic 86.4% |
| Immigrants | Australia | 0.0 /100 | #290 | Tragic 86.4% |
| Pima | 0.0 /100 | #291 | Tragic 86.3% |
| Okinawans | 0.0 /100 | #292 | Tragic 86.1% |
| Indians (Asian) | 0.0 /100 | #293 | Tragic 86.0% |
| Alaskan Athabascans | 0.0 /100 | #294 | Tragic 86.0% |
| Immigrants | Jamaica | 0.0 /100 | #295 | Tragic 85.8% |
| Immigrants | Spain | 0.0 /100 | #296 | Tragic 85.8% |
| Paraguayans | 0.0 /100 | #297 | Tragic 85.7% |
| Belizeans | 0.0 /100 | #298 | Tragic 85.7% |
| Yuman | 0.0 /100 | #299 | Tragic 85.5% |
| Immigrants | Russia | 0.0 /100 | #300 | Tragic 85.4% |
| Immigrants | Panama | 0.0 /100 | #301 | Tragic 85.4% |
| Moroccans | 0.0 /100 | #302 | Tragic 85.4% |
| Immigrants | Greece | 0.0 /100 | #303 | Tragic 85.4% |