Marshallese vs Immigrants from Spain 1 or more Vehicles in Household
COMPARE
Marshallese
Immigrants from Spain
1 or more Vehicles in Household
1 or more Vehicles in Household Comparison
Marshallese
Immigrants from Spain
90.4%
1 OR MORE VEHICLES IN HOUSEHOLD
88.9/ 100
METRIC RATING
129th/ 347
METRIC RANK
85.8%
1 OR MORE VEHICLES IN HOUSEHOLD
0.0/ 100
METRIC RATING
296th/ 347
METRIC RANK
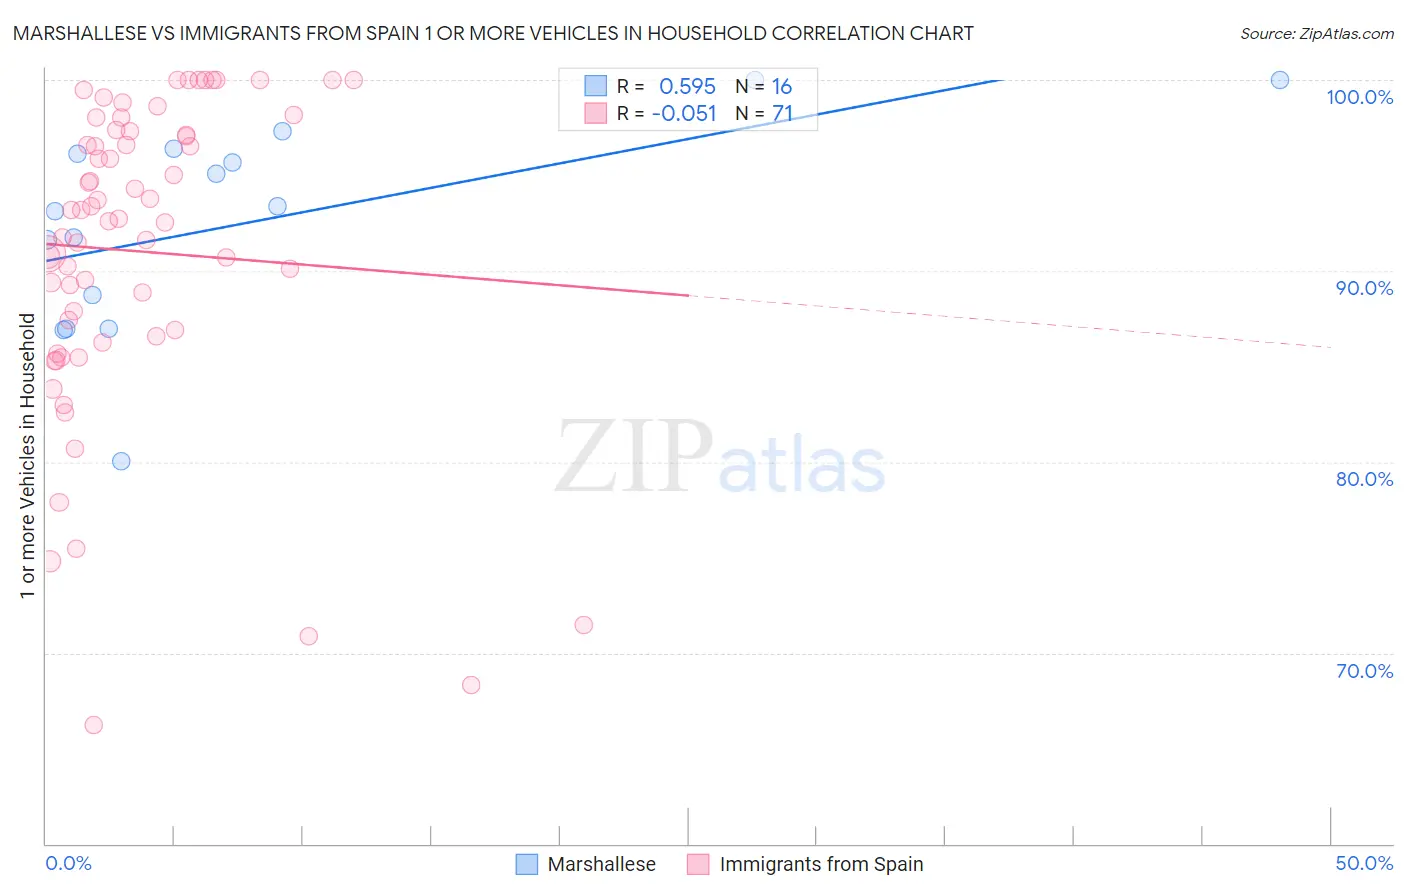
Marshallese vs Immigrants from Spain 1 or more Vehicles in Household Correlation Chart
The statistical analysis conducted on geographies consisting of 14,761,315 people shows a substantial positive correlation between the proportion of Marshallese and percentage of households with 1 or more vehicles available in the United States with a correlation coefficient (R) of 0.595 and weighted average of 90.4%. Similarly, the statistical analysis conducted on geographies consisting of 239,528,029 people shows a slight negative correlation between the proportion of Immigrants from Spain and percentage of households with 1 or more vehicles available in the United States with a correlation coefficient (R) of -0.051 and weighted average of 85.8%, a difference of 5.4%.
1 or more Vehicles in Household Correlation Summary
| Measurement | Marshallese | Immigrants from Spain |
| Minimum | 80.0% | 66.2% |
| Maximum | 100.0% | 100.0% |
| Range | 20.0% | 33.8% |
| Mean | 92.5% | 91.0% |
| Median | 93.3% | 92.8% |
| Interquartile 25% (IQ1) | 87.8% | 86.6% |
| Interquartile 75% (IQ3) | 96.3% | 97.3% |
| Interquartile Range (IQR) | 8.4% | 10.8% |
| Standard Deviation (Sample) | 5.5% | 8.2% |
| Standard Deviation (Population) | 5.3% | 8.1% |
Similar Demographics by 1 or more Vehicles in Household
Demographics Similar to Marshallese by 1 or more Vehicles in Household
In terms of 1 or more vehicles in household, the demographic groups most similar to Marshallese are Nicaraguan (90.4%, a difference of 0.0%), Immigrants from the Azores (90.4%, a difference of 0.010%), Burmese (90.4%, a difference of 0.010%), Immigrants from Cameroon (90.4%, a difference of 0.020%), and Immigrants from Kenya (90.4%, a difference of 0.020%).
| Demographics | Rating | Rank | 1 or more Vehicles in Household |
| Costa Ricans | 92.0 /100 | #122 | Exceptional 90.5% |
| Fijians | 91.8 /100 | #123 | Exceptional 90.5% |
| Puget Sound Salish | 91.5 /100 | #124 | Exceptional 90.5% |
| Immigrants | Korea | 90.5 /100 | #125 | Exceptional 90.5% |
| Immigrants | Cameroon | 89.4 /100 | #126 | Excellent 90.4% |
| Immigrants | Azores | 89.1 /100 | #127 | Excellent 90.4% |
| Burmese | 89.0 /100 | #128 | Excellent 90.4% |
| Marshallese | 88.9 /100 | #129 | Excellent 90.4% |
| Nicaraguans | 88.8 /100 | #130 | Excellent 90.4% |
| Immigrants | Kenya | 88.5 /100 | #131 | Excellent 90.4% |
| Immigrants | South Africa | 88.1 /100 | #132 | Excellent 90.4% |
| Immigrants | Syria | 87.5 /100 | #133 | Excellent 90.4% |
| Kenyans | 87.0 /100 | #134 | Excellent 90.4% |
| Immigrants | Oceania | 86.9 /100 | #135 | Excellent 90.4% |
| Hungarians | 86.5 /100 | #136 | Excellent 90.3% |
Demographics Similar to Immigrants from Spain by 1 or more Vehicles in Household
In terms of 1 or more vehicles in household, the demographic groups most similar to Immigrants from Spain are Immigrants from Jamaica (85.8%, a difference of 0.030%), Paraguayan (85.7%, a difference of 0.090%), Belizean (85.7%, a difference of 0.17%), Alaskan Athabascan (86.0%, a difference of 0.20%), and Indian (Asian) (86.0%, a difference of 0.28%).
| Demographics | Rating | Rank | 1 or more Vehicles in Household |
| Immigrants | Ireland | 0.0 /100 | #289 | Tragic 86.4% |
| Immigrants | Australia | 0.0 /100 | #290 | Tragic 86.4% |
| Pima | 0.0 /100 | #291 | Tragic 86.3% |
| Okinawans | 0.0 /100 | #292 | Tragic 86.1% |
| Indians (Asian) | 0.0 /100 | #293 | Tragic 86.0% |
| Alaskan Athabascans | 0.0 /100 | #294 | Tragic 86.0% |
| Immigrants | Jamaica | 0.0 /100 | #295 | Tragic 85.8% |
| Immigrants | Spain | 0.0 /100 | #296 | Tragic 85.8% |
| Paraguayans | 0.0 /100 | #297 | Tragic 85.7% |
| Belizeans | 0.0 /100 | #298 | Tragic 85.7% |
| Yuman | 0.0 /100 | #299 | Tragic 85.5% |
| Immigrants | Russia | 0.0 /100 | #300 | Tragic 85.4% |
| Immigrants | Panama | 0.0 /100 | #301 | Tragic 85.4% |
| Moroccans | 0.0 /100 | #302 | Tragic 85.4% |
| Immigrants | Greece | 0.0 /100 | #303 | Tragic 85.4% |