Immigrants from Nicaragua vs Mongolian 1 or more Vehicles in Household
COMPARE
Immigrants from Nicaragua
Mongolian
1 or more Vehicles in Household
1 or more Vehicles in Household Comparison
Immigrants from Nicaragua
Mongolians
90.1%
1 OR MORE VEHICLES IN HOUSEHOLD
76.7/ 100
METRIC RATING
149th/ 347
METRIC RANK
87.0%
1 OR MORE VEHICLES IN HOUSEHOLD
0.0/ 100
METRIC RATING
281st/ 347
METRIC RANK
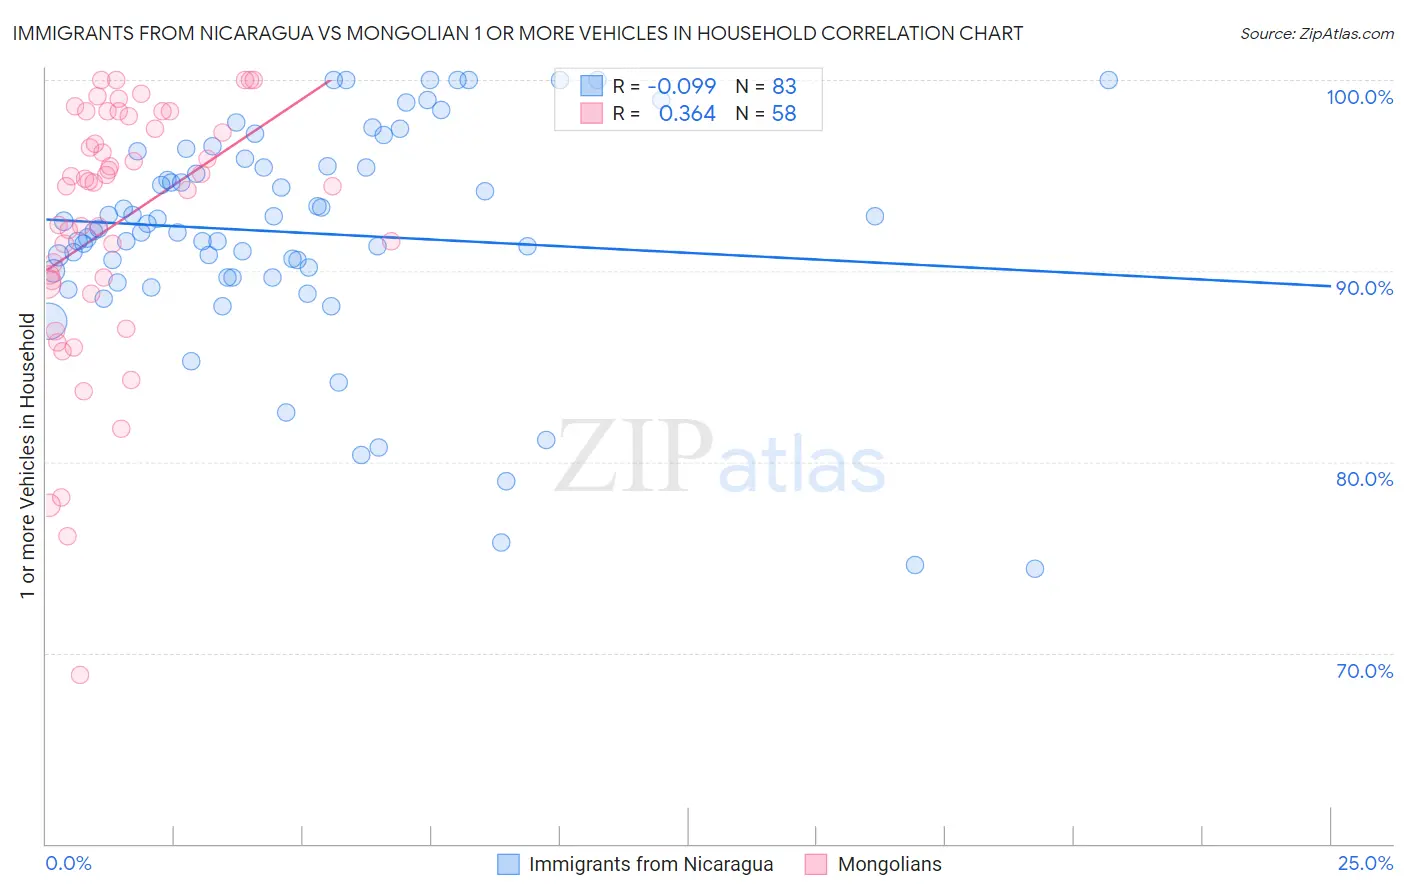
Immigrants from Nicaragua vs Mongolian 1 or more Vehicles in Household Correlation Chart
The statistical analysis conducted on geographies consisting of 236,317,806 people shows a slight negative correlation between the proportion of Immigrants from Nicaragua and percentage of households with 1 or more vehicles available in the United States with a correlation coefficient (R) of -0.099 and weighted average of 90.1%. Similarly, the statistical analysis conducted on geographies consisting of 140,176,126 people shows a mild positive correlation between the proportion of Mongolians and percentage of households with 1 or more vehicles available in the United States with a correlation coefficient (R) of 0.364 and weighted average of 87.0%, a difference of 3.6%.
1 or more Vehicles in Household Correlation Summary
| Measurement | Immigrants from Nicaragua | Mongolian |
| Minimum | 74.4% | 68.8% |
| Maximum | 100.0% | 100.0% |
| Range | 25.6% | 31.2% |
| Mean | 92.0% | 92.6% |
| Median | 92.2% | 94.6% |
| Interquartile 25% (IQ1) | 89.7% | 89.5% |
| Interquartile 75% (IQ3) | 95.9% | 98.1% |
| Interquartile Range (IQR) | 6.2% | 8.6% |
| Standard Deviation (Sample) | 5.8% | 6.7% |
| Standard Deviation (Population) | 5.8% | 6.7% |
Similar Demographics by 1 or more Vehicles in Household
Demographics Similar to Immigrants from Nicaragua by 1 or more Vehicles in Household
In terms of 1 or more vehicles in household, the demographic groups most similar to Immigrants from Nicaragua are Immigrants from Micronesia (90.1%, a difference of 0.020%), Immigrants from Eastern Africa (90.1%, a difference of 0.030%), Immigrants from Bosnia and Herzegovina (90.1%, a difference of 0.030%), Tlingit-Haida (90.1%, a difference of 0.050%), and New Zealander (90.1%, a difference of 0.060%).
| Demographics | Rating | Rank | 1 or more Vehicles in Household |
| Immigrants | Lithuania | 83.0 /100 | #142 | Excellent 90.2% |
| Immigrants | Bahamas | 81.5 /100 | #143 | Excellent 90.2% |
| Immigrants | Zimbabwe | 81.5 /100 | #144 | Excellent 90.2% |
| Sioux | 81.3 /100 | #145 | Excellent 90.2% |
| Bahamians | 80.5 /100 | #146 | Excellent 90.2% |
| Chileans | 79.8 /100 | #147 | Good 90.2% |
| Immigrants | Eastern Africa | 78.2 /100 | #148 | Good 90.1% |
| Immigrants | Nicaragua | 76.7 /100 | #149 | Good 90.1% |
| Immigrants | Micronesia | 75.9 /100 | #150 | Good 90.1% |
| Immigrants | Bosnia and Herzegovina | 75.4 /100 | #151 | Good 90.1% |
| Tlingit-Haida | 74.3 /100 | #152 | Good 90.1% |
| New Zealanders | 73.8 /100 | #153 | Good 90.1% |
| Immigrants | Uganda | 73.8 /100 | #154 | Good 90.1% |
| Immigrants | Immigrants | 73.6 /100 | #155 | Good 90.1% |
| Australians | 72.4 /100 | #156 | Good 90.0% |
Demographics Similar to Mongolians by 1 or more Vehicles in Household
In terms of 1 or more vehicles in household, the demographic groups most similar to Mongolians are Immigrants from Croatia (87.0%, a difference of 0.060%), Immigrants from Albania (87.1%, a difference of 0.090%), Immigrants from Southern Europe (87.1%, a difference of 0.10%), Alsatian (87.1%, a difference of 0.14%), and Immigrants from France (87.1%, a difference of 0.20%).
| Demographics | Rating | Rank | 1 or more Vehicles in Household |
| Immigrants | Morocco | 0.1 /100 | #274 | Tragic 87.4% |
| Immigrants | Singapore | 0.1 /100 | #275 | Tragic 87.2% |
| Immigrants | France | 0.1 /100 | #276 | Tragic 87.1% |
| Alsatians | 0.1 /100 | #277 | Tragic 87.1% |
| Immigrants | Southern Europe | 0.1 /100 | #278 | Tragic 87.1% |
| Immigrants | Albania | 0.1 /100 | #279 | Tragic 87.1% |
| Immigrants | Croatia | 0.0 /100 | #280 | Tragic 87.0% |
| Mongolians | 0.0 /100 | #281 | Tragic 87.0% |
| Colville | 0.0 /100 | #282 | Tragic 86.8% |
| Immigrants | Eastern Europe | 0.0 /100 | #283 | Tragic 86.7% |
| Central American Indians | 0.0 /100 | #284 | Tragic 86.7% |
| Immigrants | Kazakhstan | 0.0 /100 | #285 | Tragic 86.6% |
| Immigrants | Eastern Asia | 0.0 /100 | #286 | Tragic 86.5% |
| Immigrants | Malaysia | 0.0 /100 | #287 | Tragic 86.5% |
| Hopi | 0.0 /100 | #288 | Tragic 86.4% |