Immigrants from Nicaragua vs Choctaw 1 or more Vehicles in Household
COMPARE
Immigrants from Nicaragua
Choctaw
1 or more Vehicles in Household
1 or more Vehicles in Household Comparison
Immigrants from Nicaragua
Choctaw
90.1%
1 OR MORE VEHICLES IN HOUSEHOLD
76.7/ 100
METRIC RATING
149th/ 347
METRIC RANK
92.2%
1 OR MORE VEHICLES IN HOUSEHOLD
99.9/ 100
METRIC RATING
44th/ 347
METRIC RANK
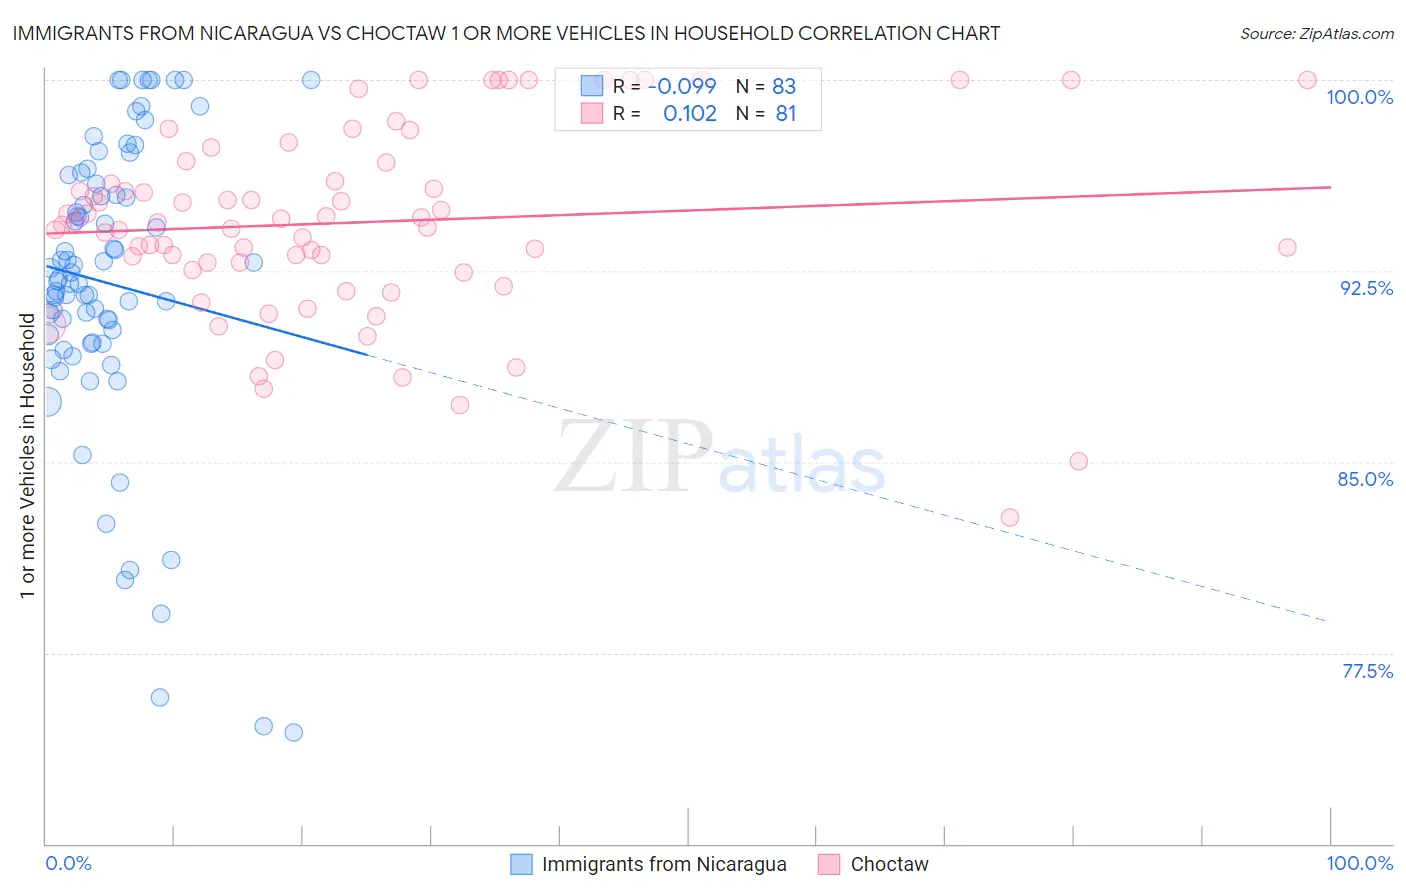
Immigrants from Nicaragua vs Choctaw 1 or more Vehicles in Household Correlation Chart
The statistical analysis conducted on geographies consisting of 236,317,806 people shows a slight negative correlation between the proportion of Immigrants from Nicaragua and percentage of households with 1 or more vehicles available in the United States with a correlation coefficient (R) of -0.099 and weighted average of 90.1%. Similarly, the statistical analysis conducted on geographies consisting of 269,639,998 people shows a poor positive correlation between the proportion of Choctaw and percentage of households with 1 or more vehicles available in the United States with a correlation coefficient (R) of 0.102 and weighted average of 92.2%, a difference of 2.4%.
1 or more Vehicles in Household Correlation Summary
| Measurement | Immigrants from Nicaragua | Choctaw |
| Minimum | 74.4% | 82.8% |
| Maximum | 100.0% | 100.0% |
| Range | 25.6% | 17.2% |
| Mean | 92.0% | 94.4% |
| Median | 92.2% | 94.3% |
| Interquartile 25% (IQ1) | 89.7% | 92.7% |
| Interquartile 75% (IQ3) | 95.9% | 96.8% |
| Interquartile Range (IQR) | 6.2% | 4.1% |
| Standard Deviation (Sample) | 5.8% | 3.7% |
| Standard Deviation (Population) | 5.8% | 3.7% |
Similar Demographics by 1 or more Vehicles in Household
Demographics Similar to Immigrants from Nicaragua by 1 or more Vehicles in Household
In terms of 1 or more vehicles in household, the demographic groups most similar to Immigrants from Nicaragua are Immigrants from Micronesia (90.1%, a difference of 0.020%), Immigrants from Eastern Africa (90.1%, a difference of 0.030%), Immigrants from Bosnia and Herzegovina (90.1%, a difference of 0.030%), Tlingit-Haida (90.1%, a difference of 0.050%), and New Zealander (90.1%, a difference of 0.060%).
| Demographics | Rating | Rank | 1 or more Vehicles in Household |
| Immigrants | Lithuania | 83.0 /100 | #142 | Excellent 90.2% |
| Immigrants | Bahamas | 81.5 /100 | #143 | Excellent 90.2% |
| Immigrants | Zimbabwe | 81.5 /100 | #144 | Excellent 90.2% |
| Sioux | 81.3 /100 | #145 | Excellent 90.2% |
| Bahamians | 80.5 /100 | #146 | Excellent 90.2% |
| Chileans | 79.8 /100 | #147 | Good 90.2% |
| Immigrants | Eastern Africa | 78.2 /100 | #148 | Good 90.1% |
| Immigrants | Nicaragua | 76.7 /100 | #149 | Good 90.1% |
| Immigrants | Micronesia | 75.9 /100 | #150 | Good 90.1% |
| Immigrants | Bosnia and Herzegovina | 75.4 /100 | #151 | Good 90.1% |
| Tlingit-Haida | 74.3 /100 | #152 | Good 90.1% |
| New Zealanders | 73.8 /100 | #153 | Good 90.1% |
| Immigrants | Uganda | 73.8 /100 | #154 | Good 90.1% |
| Immigrants | Immigrants | 73.6 /100 | #155 | Good 90.1% |
| Australians | 72.4 /100 | #156 | Good 90.0% |
Demographics Similar to Choctaw by 1 or more Vehicles in Household
In terms of 1 or more vehicles in household, the demographic groups most similar to Choctaw are Chickasaw (92.3%, a difference of 0.020%), Spanish (92.3%, a difference of 0.020%), Nonimmigrants (92.2%, a difference of 0.020%), Immigrants from Taiwan (92.3%, a difference of 0.030%), and Immigrants from Fiji (92.2%, a difference of 0.040%).
| Demographics | Rating | Rank | 1 or more Vehicles in Household |
| French Canadians | 99.9 /100 | #37 | Exceptional 92.3% |
| Immigrants | Vietnam | 99.9 /100 | #38 | Exceptional 92.3% |
| Swiss | 99.9 /100 | #39 | Exceptional 92.3% |
| Creek | 99.9 /100 | #40 | Exceptional 92.3% |
| Immigrants | Taiwan | 99.9 /100 | #41 | Exceptional 92.3% |
| Chickasaw | 99.9 /100 | #42 | Exceptional 92.3% |
| Spanish | 99.9 /100 | #43 | Exceptional 92.3% |
| Choctaw | 99.9 /100 | #44 | Exceptional 92.2% |
| Immigrants | Nonimmigrants | 99.9 /100 | #45 | Exceptional 92.2% |
| Immigrants | Fiji | 99.9 /100 | #46 | Exceptional 92.2% |
| Northern Europeans | 99.9 /100 | #47 | Exceptional 92.2% |
| Belgians | 99.9 /100 | #48 | Exceptional 92.1% |
| Afghans | 99.9 /100 | #49 | Exceptional 92.1% |
| Guamanians/Chamorros | 99.9 /100 | #50 | Exceptional 92.1% |
| Celtics | 99.9 /100 | #51 | Exceptional 92.1% |