Asian vs Choctaw 1 or more Vehicles in Household
COMPARE
Asian
Choctaw
1 or more Vehicles in Household
1 or more Vehicles in Household Comparison
Asians
Choctaw
91.1%
1 OR MORE VEHICLES IN HOUSEHOLD
98.2/ 100
METRIC RATING
104th/ 347
METRIC RANK
92.2%
1 OR MORE VEHICLES IN HOUSEHOLD
99.9/ 100
METRIC RATING
44th/ 347
METRIC RANK
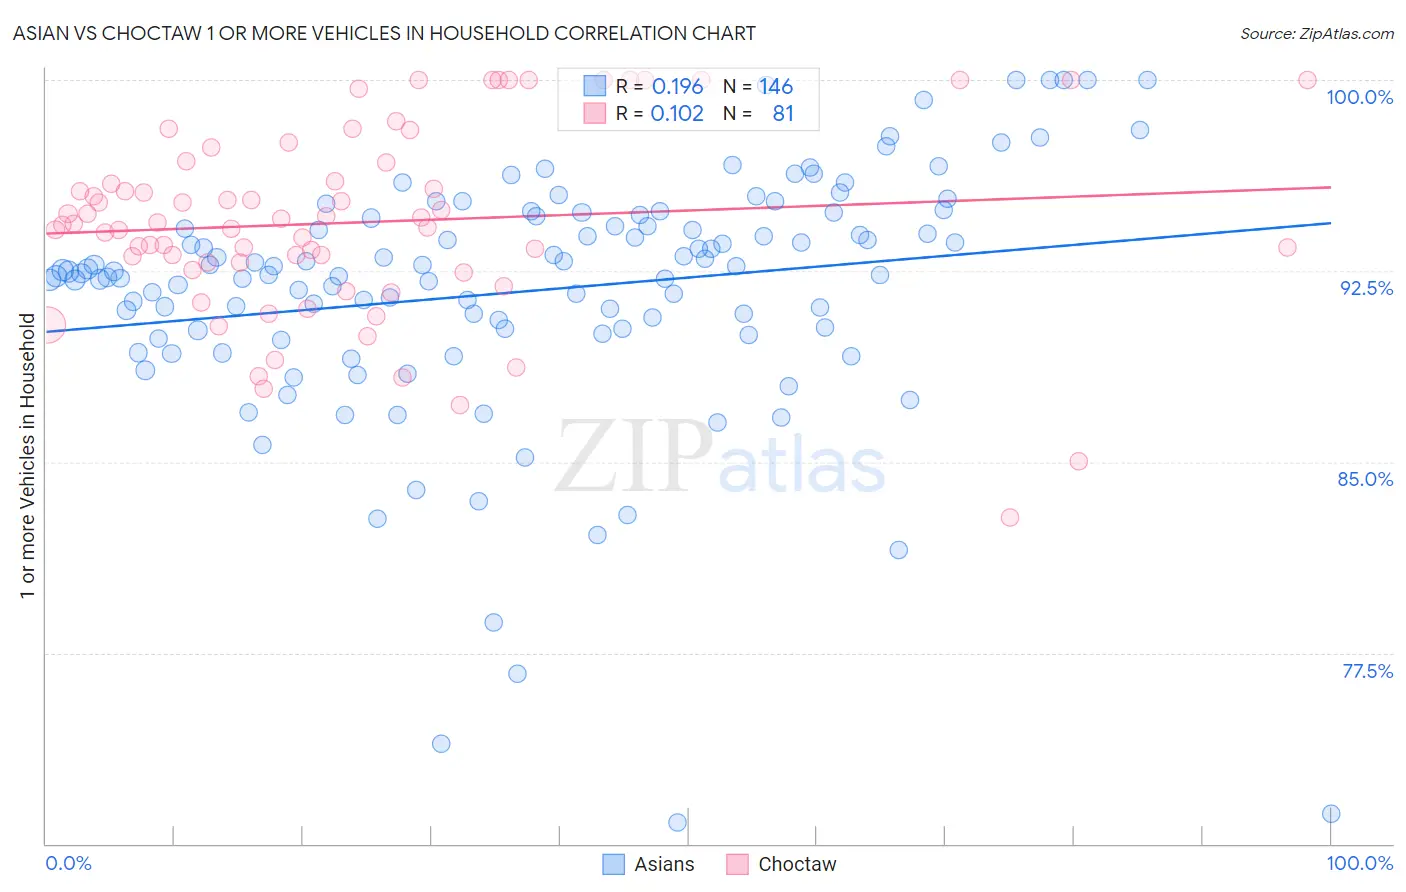
Asian vs Choctaw 1 or more Vehicles in Household Correlation Chart
The statistical analysis conducted on geographies consisting of 538,010,988 people shows a poor positive correlation between the proportion of Asians and percentage of households with 1 or more vehicles available in the United States with a correlation coefficient (R) of 0.196 and weighted average of 91.1%. Similarly, the statistical analysis conducted on geographies consisting of 269,639,998 people shows a poor positive correlation between the proportion of Choctaw and percentage of households with 1 or more vehicles available in the United States with a correlation coefficient (R) of 0.102 and weighted average of 92.2%, a difference of 1.3%.
1 or more Vehicles in Household Correlation Summary
| Measurement | Asian | Choctaw |
| Minimum | 70.8% | 82.8% |
| Maximum | 100.0% | 100.0% |
| Range | 29.2% | 17.2% |
| Mean | 91.7% | 94.4% |
| Median | 92.4% | 94.3% |
| Interquartile 25% (IQ1) | 90.2% | 92.7% |
| Interquartile 75% (IQ3) | 94.6% | 96.8% |
| Interquartile Range (IQR) | 4.4% | 4.1% |
| Standard Deviation (Sample) | 5.0% | 3.7% |
| Standard Deviation (Population) | 4.9% | 3.7% |
Similar Demographics by 1 or more Vehicles in Household
Demographics Similar to Asians by 1 or more Vehicles in Household
In terms of 1 or more vehicles in household, the demographic groups most similar to Asians are Yugoslavian (91.1%, a difference of 0.010%), Seminole (91.1%, a difference of 0.020%), Bulgarian (91.1%, a difference of 0.040%), Laotian (91.0%, a difference of 0.040%), and Immigrants from Central America (91.1%, a difference of 0.050%).
| Demographics | Rating | Rank | 1 or more Vehicles in Household |
| Pakistanis | 99.0 /100 | #97 | Exceptional 91.3% |
| Slavs | 98.7 /100 | #98 | Exceptional 91.2% |
| Immigrants | Bolivia | 98.6 /100 | #99 | Exceptional 91.2% |
| Immigrants | Central America | 98.4 /100 | #100 | Exceptional 91.1% |
| Bulgarians | 98.4 /100 | #101 | Exceptional 91.1% |
| Seminole | 98.3 /100 | #102 | Exceptional 91.1% |
| Yugoslavians | 98.3 /100 | #103 | Exceptional 91.1% |
| Asians | 98.2 /100 | #104 | Exceptional 91.1% |
| Laotians | 98.0 /100 | #105 | Exceptional 91.0% |
| Zimbabweans | 97.7 /100 | #106 | Exceptional 91.0% |
| Maltese | 97.7 /100 | #107 | Exceptional 91.0% |
| Hispanics or Latinos | 97.6 /100 | #108 | Exceptional 91.0% |
| Delaware | 97.6 /100 | #109 | Exceptional 91.0% |
| Mexican American Indians | 97.4 /100 | #110 | Exceptional 91.0% |
| Navajo | 95.8 /100 | #111 | Exceptional 90.8% |
Demographics Similar to Choctaw by 1 or more Vehicles in Household
In terms of 1 or more vehicles in household, the demographic groups most similar to Choctaw are Chickasaw (92.3%, a difference of 0.020%), Spanish (92.3%, a difference of 0.020%), Nonimmigrants (92.2%, a difference of 0.020%), Immigrants from Taiwan (92.3%, a difference of 0.030%), and Immigrants from Fiji (92.2%, a difference of 0.040%).
| Demographics | Rating | Rank | 1 or more Vehicles in Household |
| French Canadians | 99.9 /100 | #37 | Exceptional 92.3% |
| Immigrants | Vietnam | 99.9 /100 | #38 | Exceptional 92.3% |
| Swiss | 99.9 /100 | #39 | Exceptional 92.3% |
| Creek | 99.9 /100 | #40 | Exceptional 92.3% |
| Immigrants | Taiwan | 99.9 /100 | #41 | Exceptional 92.3% |
| Chickasaw | 99.9 /100 | #42 | Exceptional 92.3% |
| Spanish | 99.9 /100 | #43 | Exceptional 92.3% |
| Choctaw | 99.9 /100 | #44 | Exceptional 92.2% |
| Immigrants | Nonimmigrants | 99.9 /100 | #45 | Exceptional 92.2% |
| Immigrants | Fiji | 99.9 /100 | #46 | Exceptional 92.2% |
| Northern Europeans | 99.9 /100 | #47 | Exceptional 92.2% |
| Belgians | 99.9 /100 | #48 | Exceptional 92.1% |
| Afghans | 99.9 /100 | #49 | Exceptional 92.1% |
| Guamanians/Chamorros | 99.9 /100 | #50 | Exceptional 92.1% |
| Celtics | 99.9 /100 | #51 | Exceptional 92.1% |