Menominee vs Choctaw 1 or more Vehicles in Household
COMPARE
Menominee
Choctaw
1 or more Vehicles in Household
1 or more Vehicles in Household Comparison
Menominee
Choctaw
88.3%
1 OR MORE VEHICLES IN HOUSEHOLD
1.9/ 100
METRIC RATING
246th/ 347
METRIC RANK
92.2%
1 OR MORE VEHICLES IN HOUSEHOLD
99.9/ 100
METRIC RATING
44th/ 347
METRIC RANK
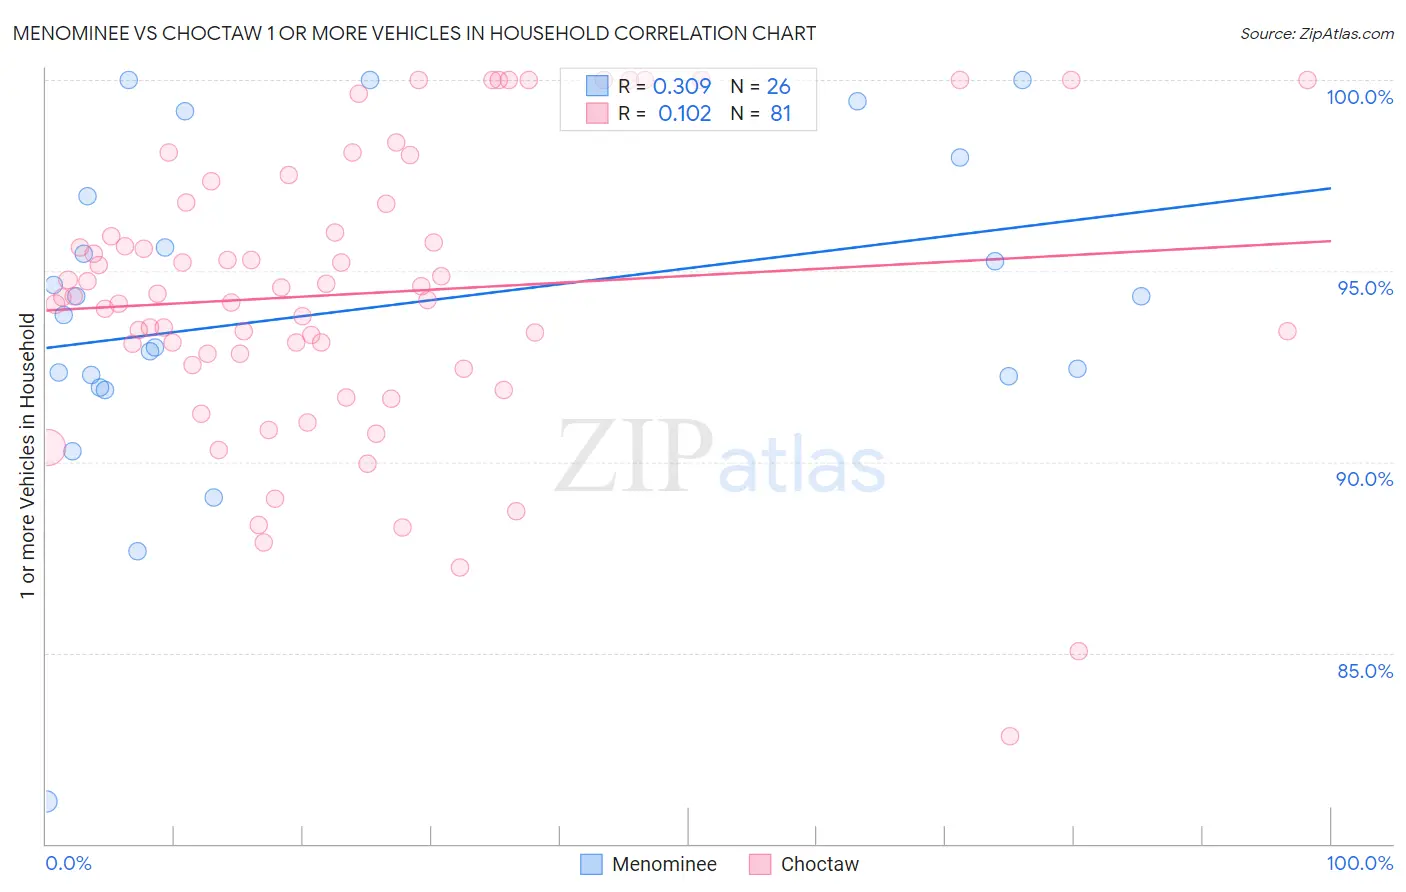
Menominee vs Choctaw 1 or more Vehicles in Household Correlation Chart
The statistical analysis conducted on geographies consisting of 45,777,849 people shows a mild positive correlation between the proportion of Menominee and percentage of households with 1 or more vehicles available in the United States with a correlation coefficient (R) of 0.309 and weighted average of 88.3%. Similarly, the statistical analysis conducted on geographies consisting of 269,639,998 people shows a poor positive correlation between the proportion of Choctaw and percentage of households with 1 or more vehicles available in the United States with a correlation coefficient (R) of 0.102 and weighted average of 92.2%, a difference of 4.4%.
1 or more Vehicles in Household Correlation Summary
| Measurement | Menominee | Choctaw |
| Minimum | 81.1% | 82.8% |
| Maximum | 100.0% | 100.0% |
| Range | 18.9% | 17.2% |
| Mean | 94.0% | 94.4% |
| Median | 94.1% | 94.3% |
| Interquartile 25% (IQ1) | 92.2% | 92.7% |
| Interquartile 75% (IQ3) | 97.0% | 96.8% |
| Interquartile Range (IQR) | 4.7% | 4.1% |
| Standard Deviation (Sample) | 4.3% | 3.7% |
| Standard Deviation (Population) | 4.2% | 3.7% |
Similar Demographics by 1 or more Vehicles in Household
Demographics Similar to Menominee by 1 or more Vehicles in Household
In terms of 1 or more vehicles in household, the demographic groups most similar to Menominee are Immigrants from Czechoslovakia (88.3%, a difference of 0.010%), Immigrants from Portugal (88.3%, a difference of 0.030%), Immigrants from Honduras (88.3%, a difference of 0.040%), Immigrants from Belgium (88.4%, a difference of 0.050%), and Immigrants from Nigeria (88.2%, a difference of 0.080%).
| Demographics | Rating | Rank | 1 or more Vehicles in Household |
| Kiowa | 3.8 /100 | #239 | Tragic 88.6% |
| Eastern Europeans | 3.0 /100 | #240 | Tragic 88.5% |
| Taiwanese | 2.6 /100 | #241 | Tragic 88.4% |
| Turks | 2.5 /100 | #242 | Tragic 88.4% |
| Immigrants | Belgium | 2.1 /100 | #243 | Tragic 88.4% |
| Immigrants | Portugal | 2.0 /100 | #244 | Tragic 88.3% |
| Immigrants | Czechoslovakia | 1.9 /100 | #245 | Tragic 88.3% |
| Menominee | 1.9 /100 | #246 | Tragic 88.3% |
| Immigrants | Honduras | 1.7 /100 | #247 | Tragic 88.3% |
| Immigrants | Nigeria | 1.5 /100 | #248 | Tragic 88.2% |
| Blacks/African Americans | 1.4 /100 | #249 | Tragic 88.2% |
| Egyptians | 1.2 /100 | #250 | Tragic 88.2% |
| Immigrants | Serbia | 1.2 /100 | #251 | Tragic 88.2% |
| Immigrants | Uruguay | 1.1 /100 | #252 | Tragic 88.1% |
| Hondurans | 1.0 /100 | #253 | Tragic 88.1% |
Demographics Similar to Choctaw by 1 or more Vehicles in Household
In terms of 1 or more vehicles in household, the demographic groups most similar to Choctaw are Chickasaw (92.3%, a difference of 0.020%), Spanish (92.3%, a difference of 0.020%), Nonimmigrants (92.2%, a difference of 0.020%), Immigrants from Taiwan (92.3%, a difference of 0.030%), and Immigrants from Fiji (92.2%, a difference of 0.040%).
| Demographics | Rating | Rank | 1 or more Vehicles in Household |
| French Canadians | 99.9 /100 | #37 | Exceptional 92.3% |
| Immigrants | Vietnam | 99.9 /100 | #38 | Exceptional 92.3% |
| Swiss | 99.9 /100 | #39 | Exceptional 92.3% |
| Creek | 99.9 /100 | #40 | Exceptional 92.3% |
| Immigrants | Taiwan | 99.9 /100 | #41 | Exceptional 92.3% |
| Chickasaw | 99.9 /100 | #42 | Exceptional 92.3% |
| Spanish | 99.9 /100 | #43 | Exceptional 92.3% |
| Choctaw | 99.9 /100 | #44 | Exceptional 92.2% |
| Immigrants | Nonimmigrants | 99.9 /100 | #45 | Exceptional 92.2% |
| Immigrants | Fiji | 99.9 /100 | #46 | Exceptional 92.2% |
| Northern Europeans | 99.9 /100 | #47 | Exceptional 92.2% |
| Belgians | 99.9 /100 | #48 | Exceptional 92.1% |
| Afghans | 99.9 /100 | #49 | Exceptional 92.1% |
| Guamanians/Chamorros | 99.9 /100 | #50 | Exceptional 92.1% |
| Celtics | 99.9 /100 | #51 | Exceptional 92.1% |