Laotian vs Welsh 1 or more Vehicles in Household
COMPARE
Laotian
Welsh
1 or more Vehicles in Household
1 or more Vehicles in Household Comparison
Laotians
Welsh
91.0%
1 OR MORE VEHICLES IN HOUSEHOLD
98.0/ 100
METRIC RATING
105th/ 347
METRIC RANK
93.0%
1 OR MORE VEHICLES IN HOUSEHOLD
100.0/ 100
METRIC RATING
18th/ 347
METRIC RANK
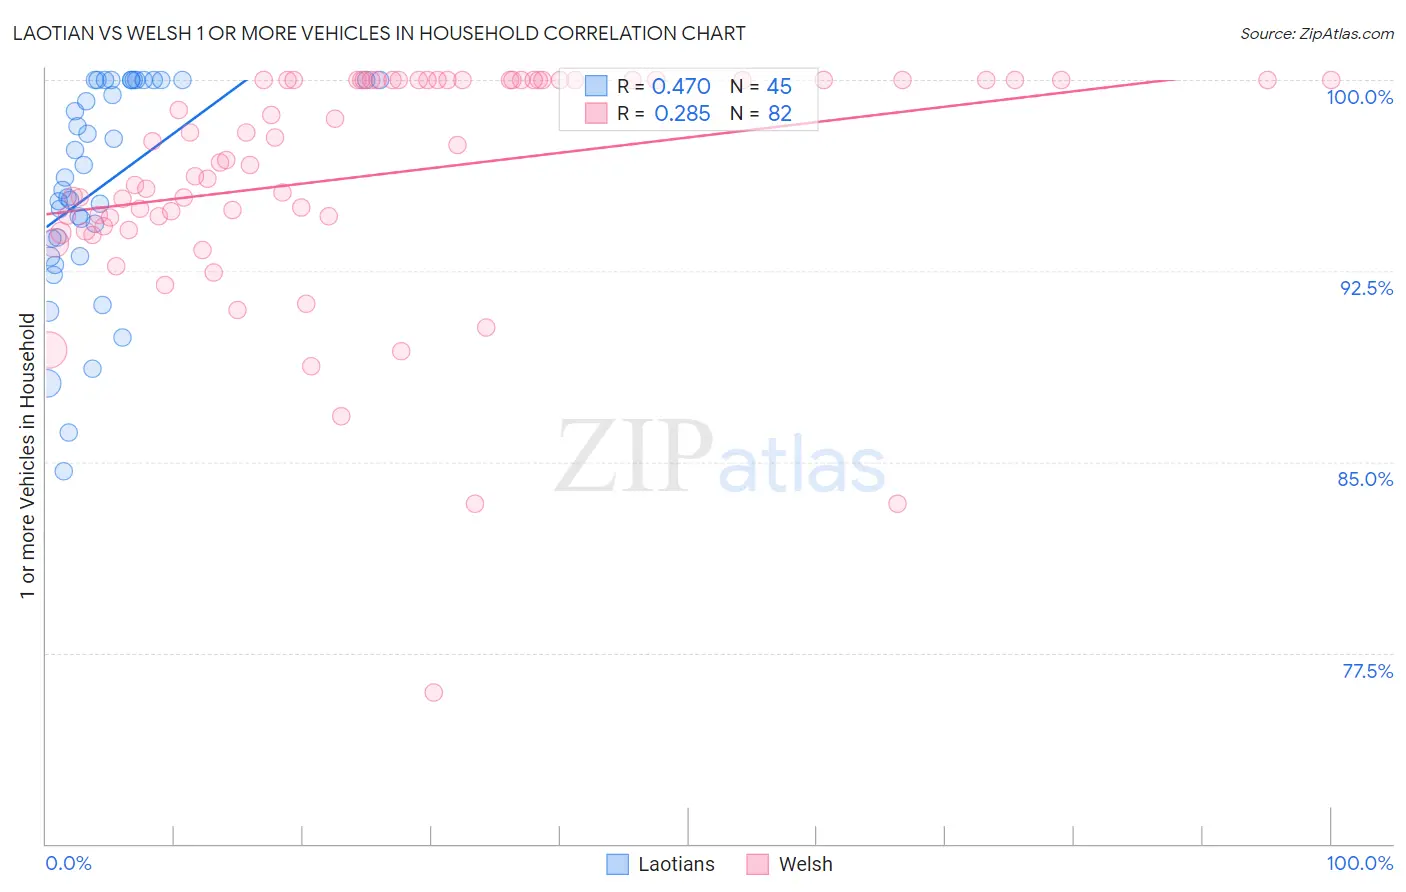
Laotian vs Welsh 1 or more Vehicles in Household Correlation Chart
The statistical analysis conducted on geographies consisting of 224,651,996 people shows a moderate positive correlation between the proportion of Laotians and percentage of households with 1 or more vehicles available in the United States with a correlation coefficient (R) of 0.470 and weighted average of 91.0%. Similarly, the statistical analysis conducted on geographies consisting of 528,258,241 people shows a weak positive correlation between the proportion of Welsh and percentage of households with 1 or more vehicles available in the United States with a correlation coefficient (R) of 0.285 and weighted average of 93.0%, a difference of 2.1%.
1 or more Vehicles in Household Correlation Summary
| Measurement | Laotian | Welsh |
| Minimum | 84.6% | 75.9% |
| Maximum | 100.0% | 100.0% |
| Range | 15.4% | 24.1% |
| Mean | 95.9% | 96.3% |
| Median | 96.2% | 97.1% |
| Interquartile 25% (IQ1) | 93.4% | 94.6% |
| Interquartile 75% (IQ3) | 100.0% | 100.0% |
| Interquartile Range (IQR) | 6.6% | 5.4% |
| Standard Deviation (Sample) | 4.1% | 4.6% |
| Standard Deviation (Population) | 4.1% | 4.5% |
Similar Demographics by 1 or more Vehicles in Household
Demographics Similar to Laotians by 1 or more Vehicles in Household
In terms of 1 or more vehicles in household, the demographic groups most similar to Laotians are Asian (91.1%, a difference of 0.040%), Zimbabwean (91.0%, a difference of 0.040%), Yugoslavian (91.1%, a difference of 0.060%), Maltese (91.0%, a difference of 0.060%), and Hispanic or Latino (91.0%, a difference of 0.060%).
| Demographics | Rating | Rank | 1 or more Vehicles in Household |
| Slavs | 98.7 /100 | #98 | Exceptional 91.2% |
| Immigrants | Bolivia | 98.6 /100 | #99 | Exceptional 91.2% |
| Immigrants | Central America | 98.4 /100 | #100 | Exceptional 91.1% |
| Bulgarians | 98.4 /100 | #101 | Exceptional 91.1% |
| Seminole | 98.3 /100 | #102 | Exceptional 91.1% |
| Yugoslavians | 98.3 /100 | #103 | Exceptional 91.1% |
| Asians | 98.2 /100 | #104 | Exceptional 91.1% |
| Laotians | 98.0 /100 | #105 | Exceptional 91.0% |
| Zimbabweans | 97.7 /100 | #106 | Exceptional 91.0% |
| Maltese | 97.7 /100 | #107 | Exceptional 91.0% |
| Hispanics or Latinos | 97.6 /100 | #108 | Exceptional 91.0% |
| Delaware | 97.6 /100 | #109 | Exceptional 91.0% |
| Mexican American Indians | 97.4 /100 | #110 | Exceptional 91.0% |
| Navajo | 95.8 /100 | #111 | Exceptional 90.8% |
| Immigrants | Netherlands | 95.7 /100 | #112 | Exceptional 90.8% |
Demographics Similar to Welsh by 1 or more Vehicles in Household
In terms of 1 or more vehicles in household, the demographic groups most similar to Welsh are European (93.0%, a difference of 0.040%), Mexican (93.0%, a difference of 0.060%), Assyrian/Chaldean/Syriac (93.0%, a difference of 0.060%), Irish (93.1%, a difference of 0.080%), and White/Caucasian (93.1%, a difference of 0.12%).
| Demographics | Rating | Rank | 1 or more Vehicles in Household |
| Czechs | 100.0 /100 | #11 | Exceptional 93.3% |
| Scandinavians | 100.0 /100 | #12 | Exceptional 93.1% |
| Whites/Caucasians | 100.0 /100 | #13 | Exceptional 93.1% |
| Irish | 100.0 /100 | #14 | Exceptional 93.1% |
| Mexicans | 100.0 /100 | #15 | Exceptional 93.0% |
| Assyrians/Chaldeans/Syriacs | 100.0 /100 | #16 | Exceptional 93.0% |
| Europeans | 100.0 /100 | #17 | Exceptional 93.0% |
| Welsh | 100.0 /100 | #18 | Exceptional 93.0% |
| Tongans | 100.0 /100 | #19 | Exceptional 92.9% |
| Arapaho | 100.0 /100 | #20 | Exceptional 92.7% |
| Ottawa | 100.0 /100 | #21 | Exceptional 92.7% |
| French | 100.0 /100 | #22 | Exceptional 92.7% |
| Nepalese | 100.0 /100 | #23 | Exceptional 92.6% |
| Yaqui | 100.0 /100 | #24 | Exceptional 92.6% |
| Immigrants | Iraq | 100.0 /100 | #25 | Exceptional 92.5% |