Immigrants from Micronesia vs Immigrants from Morocco Unemployment Among Women with Children Ages 6 to 17 years
COMPARE
Immigrants from Micronesia
Immigrants from Morocco
Unemployment Among Women with Children Ages 6 to 17 years
Unemployment Among Women with Children Ages 6 to 17 years Comparison
Immigrants from Micronesia
Immigrants from Morocco
8.9%
UNEMPLOYMENT AMONG WOMEN WITH CHILDREN AGES 6 TO 17 YEARS
59.2/ 100
METRIC RATING
165th/ 347
METRIC RANK
8.7%
UNEMPLOYMENT AMONG WOMEN WITH CHILDREN AGES 6 TO 17 YEARS
94.9/ 100
METRIC RATING
123rd/ 347
METRIC RANK
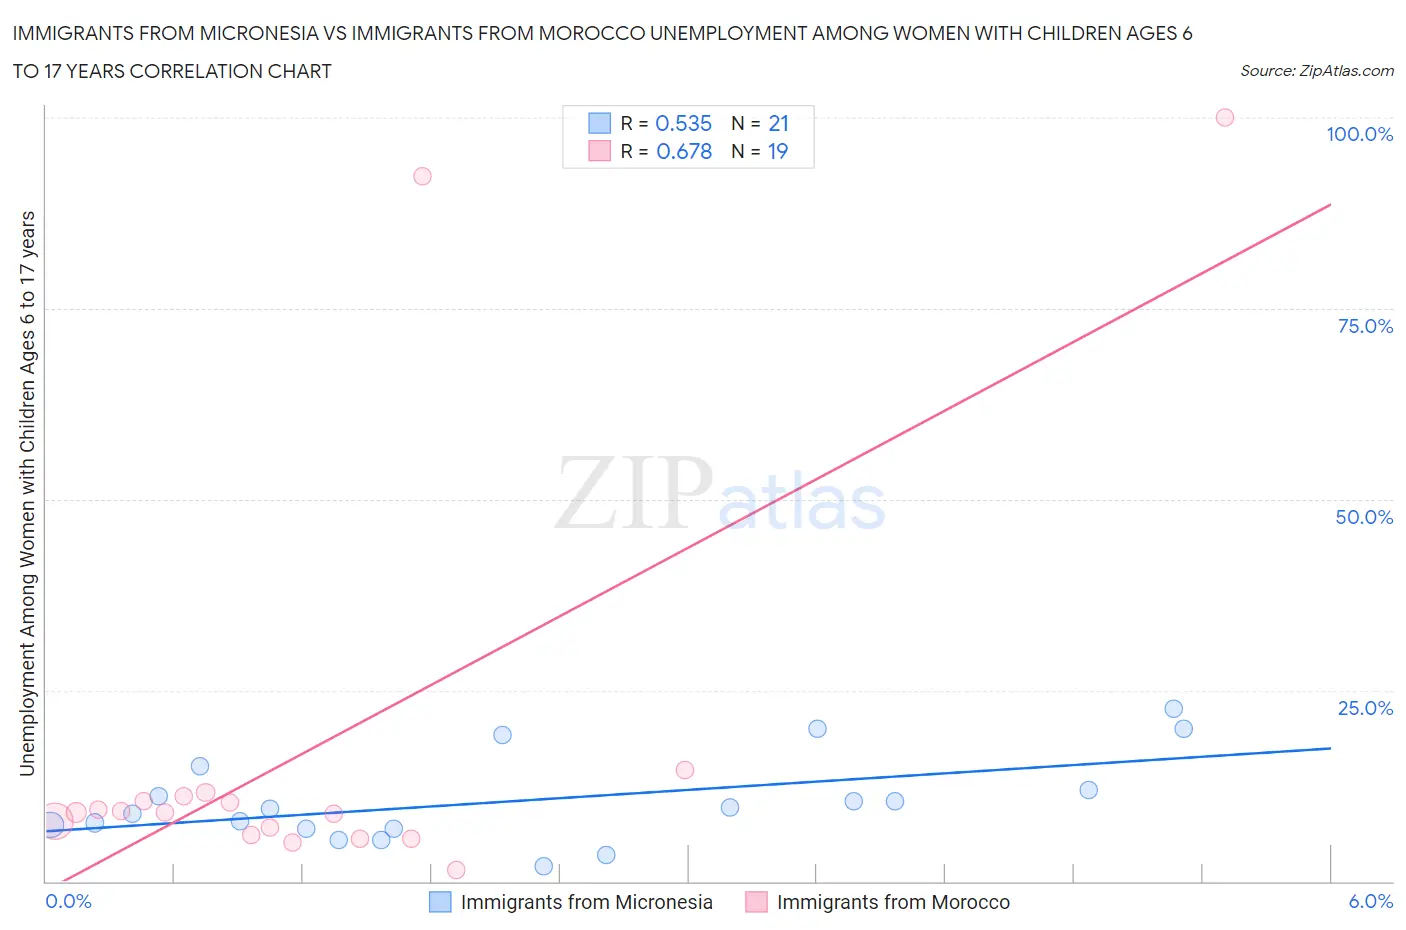
Immigrants from Micronesia vs Immigrants from Morocco Unemployment Among Women with Children Ages 6 to 17 years Correlation Chart
The statistical analysis conducted on geographies consisting of 55,240,851 people shows a substantial positive correlation between the proportion of Immigrants from Micronesia and unemployment rate among women with children between the ages 6 and 17 in the United States with a correlation coefficient (R) of 0.535 and weighted average of 8.9%. Similarly, the statistical analysis conducted on geographies consisting of 147,990,397 people shows a significant positive correlation between the proportion of Immigrants from Morocco and unemployment rate among women with children between the ages 6 and 17 in the United States with a correlation coefficient (R) of 0.678 and weighted average of 8.7%, a difference of 2.9%.
Unemployment Among Women with Children Ages 6 to 17 years Correlation Summary
| Measurement | Immigrants from Micronesia | Immigrants from Morocco |
| Minimum | 2.0% | 1.4% |
| Maximum | 22.5% | 100.0% |
| Range | 20.5% | 98.6% |
| Mean | 10.6% | 17.6% |
| Median | 9.4% | 9.1% |
| Interquartile 25% (IQ1) | 6.9% | 6.0% |
| Interquartile 75% (IQ3) | 13.5% | 11.1% |
| Interquartile Range (IQR) | 6.7% | 5.1% |
| Standard Deviation (Sample) | 5.7% | 27.9% |
| Standard Deviation (Population) | 5.6% | 27.1% |
Similar Demographics by Unemployment Among Women with Children Ages 6 to 17 years
Demographics Similar to Immigrants from Micronesia by Unemployment Among Women with Children Ages 6 to 17 years
In terms of unemployment among women with children ages 6 to 17 years, the demographic groups most similar to Immigrants from Micronesia are Ukrainian (8.9%, a difference of 0.020%), Moroccan (8.9%, a difference of 0.040%), Mexican American Indian (8.9%, a difference of 0.060%), Immigrants from Netherlands (8.9%, a difference of 0.070%), and Immigrants from England (8.9%, a difference of 0.070%).
| Demographics | Rating | Rank | Unemployment Among Women with Children Ages 6 to 17 years |
| Immigrants | Chile | 65.3 /100 | #158 | Good 8.9% |
| Spanish | 63.8 /100 | #159 | Good 8.9% |
| Immigrants | Hungary | 63.4 /100 | #160 | Good 8.9% |
| Immigrants | Guyana | 63.0 /100 | #161 | Good 8.9% |
| Immigrants | Netherlands | 60.8 /100 | #162 | Good 8.9% |
| Mexican American Indians | 60.6 /100 | #163 | Good 8.9% |
| Ukrainians | 59.7 /100 | #164 | Average 8.9% |
| Immigrants | Micronesia | 59.2 /100 | #165 | Average 8.9% |
| Moroccans | 58.3 /100 | #166 | Average 8.9% |
| Immigrants | England | 57.7 /100 | #167 | Average 8.9% |
| Immigrants | Croatia | 57.1 /100 | #168 | Average 8.9% |
| British | 55.2 /100 | #169 | Average 8.9% |
| Turks | 54.1 /100 | #170 | Average 8.9% |
| Jordanians | 52.2 /100 | #171 | Average 9.0% |
| Immigrants | West Indies | 52.2 /100 | #172 | Average 9.0% |
Demographics Similar to Immigrants from Morocco by Unemployment Among Women with Children Ages 6 to 17 years
In terms of unemployment among women with children ages 6 to 17 years, the demographic groups most similar to Immigrants from Morocco are Immigrants from Lebanon (8.7%, a difference of 0.0%), Immigrants from Egypt (8.7%, a difference of 0.040%), South African (8.7%, a difference of 0.070%), Immigrants from Northern Africa (8.7%, a difference of 0.10%), and Czech (8.7%, a difference of 0.10%).
| Demographics | Rating | Rank | Unemployment Among Women with Children Ages 6 to 17 years |
| Zimbabweans | 96.3 /100 | #116 | Exceptional 8.6% |
| Albanians | 96.3 /100 | #117 | Exceptional 8.6% |
| Pueblo | 96.2 /100 | #118 | Exceptional 8.6% |
| Immigrants | Grenada | 96.2 /100 | #119 | Exceptional 8.6% |
| Israelis | 95.9 /100 | #120 | Exceptional 8.7% |
| Immigrants | Denmark | 95.5 /100 | #121 | Exceptional 8.7% |
| Immigrants | Egypt | 95.0 /100 | #122 | Exceptional 8.7% |
| Immigrants | Morocco | 94.9 /100 | #123 | Exceptional 8.7% |
| Immigrants | Lebanon | 94.9 /100 | #124 | Exceptional 8.7% |
| South Africans | 94.6 /100 | #125 | Exceptional 8.7% |
| Immigrants | Northern Africa | 94.4 /100 | #126 | Exceptional 8.7% |
| Czechs | 94.4 /100 | #127 | Exceptional 8.7% |
| Hmong | 94.3 /100 | #128 | Exceptional 8.7% |
| Barbadians | 93.8 /100 | #129 | Exceptional 8.7% |
| Immigrants | Western Asia | 93.1 /100 | #130 | Exceptional 8.7% |