Immigrants from Micronesia vs Immigrants from Morocco In Labor Force | Age 25-29
COMPARE
Immigrants from Micronesia
Immigrants from Morocco
In Labor Force | Age 25-29
In Labor Force | Age 25-29 Comparison
Immigrants from Micronesia
Immigrants from Morocco
83.0%
IN LABOR FORCE | AGE 25-29
0.0/ 100
METRIC RATING
289th/ 347
METRIC RANK
85.5%
IN LABOR FORCE | AGE 25-29
99.5/ 100
METRIC RATING
59th/ 347
METRIC RANK
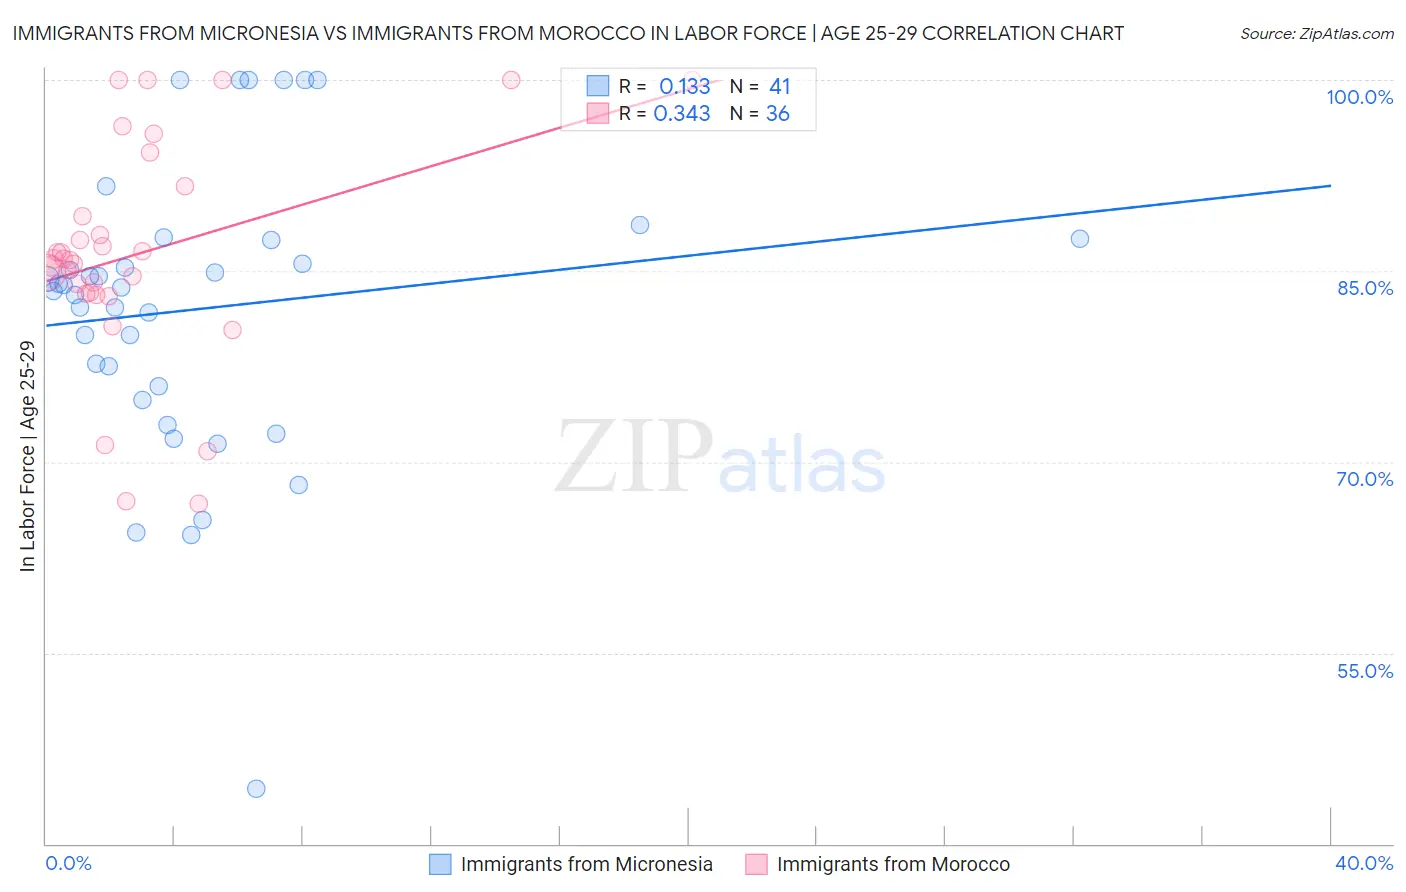
Immigrants from Micronesia vs Immigrants from Morocco In Labor Force | Age 25-29 Correlation Chart
The statistical analysis conducted on geographies consisting of 61,602,386 people shows a poor positive correlation between the proportion of Immigrants from Micronesia and labor force participation rate among population between the ages 25 and 29 in the United States with a correlation coefficient (R) of 0.133 and weighted average of 83.0%. Similarly, the statistical analysis conducted on geographies consisting of 178,899,306 people shows a mild positive correlation between the proportion of Immigrants from Morocco and labor force participation rate among population between the ages 25 and 29 in the United States with a correlation coefficient (R) of 0.343 and weighted average of 85.5%, a difference of 3.0%.
In Labor Force | Age 25-29 Correlation Summary
| Measurement | Immigrants from Micronesia | Immigrants from Morocco |
| Minimum | 44.3% | 66.7% |
| Maximum | 100.0% | 100.0% |
| Range | 55.7% | 33.3% |
| Mean | 82.0% | 86.4% |
| Median | 83.7% | 85.9% |
| Interquartile 25% (IQ1) | 75.4% | 83.3% |
| Interquartile 75% (IQ3) | 87.4% | 90.5% |
| Interquartile Range (IQR) | 12.0% | 7.2% |
| Standard Deviation (Sample) | 11.5% | 8.6% |
| Standard Deviation (Population) | 11.4% | 8.5% |
Similar Demographics by In Labor Force | Age 25-29
Demographics Similar to Immigrants from Micronesia by In Labor Force | Age 25-29
In terms of in labor force | age 25-29, the demographic groups most similar to Immigrants from Micronesia are Ottawa (83.0%, a difference of 0.020%), Immigrants from Bangladesh (83.0%, a difference of 0.030%), Hawaiian (83.0%, a difference of 0.030%), Guyanese (83.0%, a difference of 0.050%), and Immigrants from Guyana (83.0%, a difference of 0.050%).
| Demographics | Rating | Rank | In Labor Force | Age 25-29 |
| Americans | 0.0 /100 | #282 | Tragic 83.1% |
| Immigrants | Azores | 0.0 /100 | #283 | Tragic 83.1% |
| Nicaraguans | 0.0 /100 | #284 | Tragic 83.1% |
| Belizeans | 0.0 /100 | #285 | Tragic 83.1% |
| Mexican American Indians | 0.0 /100 | #286 | Tragic 83.0% |
| Guyanese | 0.0 /100 | #287 | Tragic 83.0% |
| Ottawa | 0.0 /100 | #288 | Tragic 83.0% |
| Immigrants | Micronesia | 0.0 /100 | #289 | Tragic 83.0% |
| Immigrants | Bangladesh | 0.0 /100 | #290 | Tragic 83.0% |
| Hawaiians | 0.0 /100 | #291 | Tragic 83.0% |
| Immigrants | Guyana | 0.0 /100 | #292 | Tragic 83.0% |
| Immigrants | Latin America | 0.0 /100 | #293 | Tragic 82.9% |
| Nepalese | 0.0 /100 | #294 | Tragic 82.9% |
| Chippewa | 0.0 /100 | #295 | Tragic 82.9% |
| Immigrants | Nicaragua | 0.0 /100 | #296 | Tragic 82.9% |
Demographics Similar to Immigrants from Morocco by In Labor Force | Age 25-29
In terms of in labor force | age 25-29, the demographic groups most similar to Immigrants from Morocco are Estonian (85.5%, a difference of 0.010%), Greek (85.5%, a difference of 0.010%), Eastern European (85.5%, a difference of 0.020%), Thai (85.5%, a difference of 0.030%), and Serbian (85.5%, a difference of 0.030%).
| Demographics | Rating | Rank | In Labor Force | Age 25-29 |
| Immigrants | Poland | 99.7 /100 | #52 | Exceptional 85.6% |
| Belgians | 99.7 /100 | #53 | Exceptional 85.5% |
| Albanians | 99.7 /100 | #54 | Exceptional 85.5% |
| Immigrants | Brazil | 99.7 /100 | #55 | Exceptional 85.5% |
| Eastern Europeans | 99.6 /100 | #56 | Exceptional 85.5% |
| Estonians | 99.6 /100 | #57 | Exceptional 85.5% |
| Greeks | 99.6 /100 | #58 | Exceptional 85.5% |
| Immigrants | Morocco | 99.5 /100 | #59 | Exceptional 85.5% |
| Thais | 99.5 /100 | #60 | Exceptional 85.5% |
| Serbians | 99.5 /100 | #61 | Exceptional 85.5% |
| Taiwanese | 99.4 /100 | #62 | Exceptional 85.4% |
| Immigrants | Kenya | 99.4 /100 | #63 | Exceptional 85.4% |
| Immigrants | Italy | 99.3 /100 | #64 | Exceptional 85.4% |
| Immigrants | Czechoslovakia | 99.3 /100 | #65 | Exceptional 85.4% |
| Immigrants | Scotland | 99.3 /100 | #66 | Exceptional 85.4% |