Immigrants from Lithuania vs Immigrants from Afghanistan 2 or more Vehicles in Household
COMPARE
Immigrants from Lithuania
Immigrants from Afghanistan
2 or more Vehicles in Household
2 or more Vehicles in Household Comparison
Immigrants from Lithuania
Immigrants from Afghanistan
55.8%
2 OR MORE VEHICLES IN HOUSEHOLD
70.4/ 100
METRIC RATING
156th/ 347
METRIC RANK
58.3%
2 OR MORE VEHICLES IN HOUSEHOLD
99.6/ 100
METRIC RATING
74th/ 347
METRIC RANK
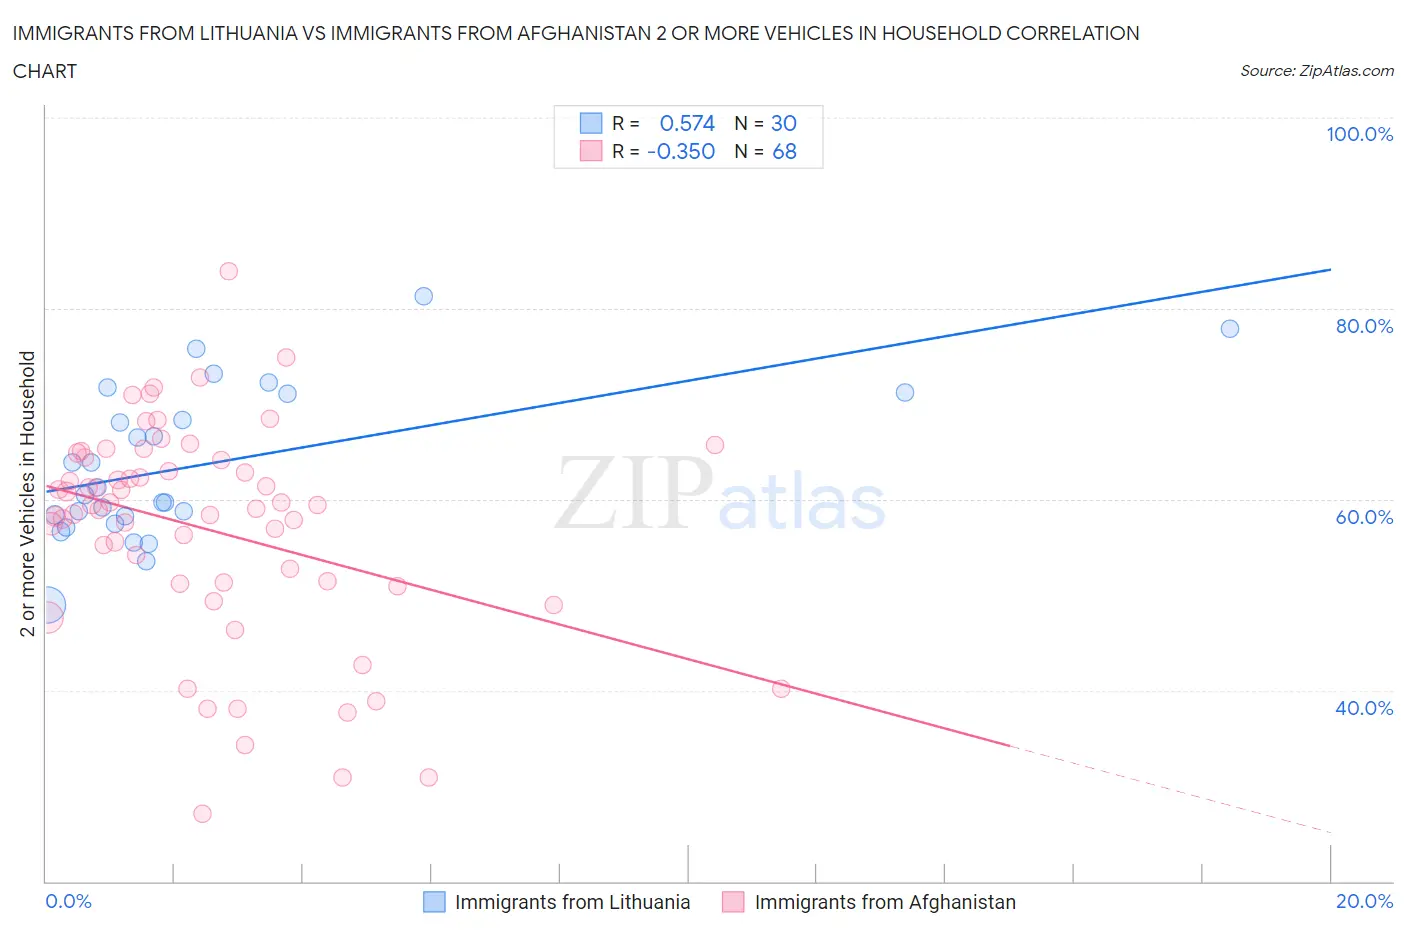
Immigrants from Lithuania vs Immigrants from Afghanistan 2 or more Vehicles in Household Correlation Chart
The statistical analysis conducted on geographies consisting of 117,713,976 people shows a substantial positive correlation between the proportion of Immigrants from Lithuania and percentage of households with 2 or more vehicles available in the United States with a correlation coefficient (R) of 0.574 and weighted average of 55.8%. Similarly, the statistical analysis conducted on geographies consisting of 147,637,495 people shows a mild negative correlation between the proportion of Immigrants from Afghanistan and percentage of households with 2 or more vehicles available in the United States with a correlation coefficient (R) of -0.350 and weighted average of 58.3%, a difference of 4.5%.
2 or more Vehicles in Household Correlation Summary
| Measurement | Immigrants from Lithuania | Immigrants from Afghanistan |
| Minimum | 49.0% | 27.1% |
| Maximum | 81.2% | 83.9% |
| Range | 32.3% | 56.8% |
| Mean | 63.7% | 56.9% |
| Median | 60.9% | 59.2% |
| Interquartile 25% (IQ1) | 58.2% | 51.2% |
| Interquartile 75% (IQ3) | 71.1% | 64.3% |
| Interquartile Range (IQR) | 12.9% | 13.0% |
| Standard Deviation (Sample) | 7.9% | 11.4% |
| Standard Deviation (Population) | 7.8% | 11.3% |
Similar Demographics by 2 or more Vehicles in Household
Demographics Similar to Immigrants from Lithuania by 2 or more Vehicles in Household
In terms of 2 or more vehicles in household, the demographic groups most similar to Immigrants from Lithuania are Immigrants from Venezuela (55.8%, a difference of 0.010%), Immigrants from Kuwait (55.8%, a difference of 0.010%), Ukrainian (55.8%, a difference of 0.020%), Lumbee (55.9%, a difference of 0.070%), and Tlingit-Haida (55.8%, a difference of 0.090%).
| Demographics | Rating | Rank | 2 or more Vehicles in Household |
| Chileans | 80.2 /100 | #149 | Excellent 56.1% |
| Nicaraguans | 79.9 /100 | #150 | Good 56.1% |
| Immigrants | Northern Europe | 78.7 /100 | #151 | Good 56.1% |
| Immigrants | Pakistan | 78.1 /100 | #152 | Good 56.1% |
| Lumbee | 71.9 /100 | #153 | Good 55.9% |
| Ukrainians | 70.8 /100 | #154 | Good 55.8% |
| Immigrants | Venezuela | 70.7 /100 | #155 | Good 55.8% |
| Immigrants | Lithuania | 70.4 /100 | #156 | Good 55.8% |
| Immigrants | Kuwait | 70.2 /100 | #157 | Good 55.8% |
| Tlingit-Haida | 68.5 /100 | #158 | Good 55.8% |
| Paiute | 68.0 /100 | #159 | Good 55.8% |
| Crow | 67.0 /100 | #160 | Good 55.7% |
| Colville | 61.1 /100 | #161 | Good 55.6% |
| German Russians | 60.9 /100 | #162 | Good 55.6% |
| Immigrants | Zimbabwe | 60.2 /100 | #163 | Good 55.6% |
Demographics Similar to Immigrants from Afghanistan by 2 or more Vehicles in Household
In terms of 2 or more vehicles in household, the demographic groups most similar to Immigrants from Afghanistan are Bolivian (58.3%, a difference of 0.0%), Polish (58.3%, a difference of 0.080%), Creek (58.3%, a difference of 0.11%), Slovene (58.3%, a difference of 0.12%), and Austrian (58.4%, a difference of 0.13%).
| Demographics | Rating | Rank | 2 or more Vehicles in Household |
| Laotians | 99.7 /100 | #67 | Exceptional 58.6% |
| Canadians | 99.7 /100 | #68 | Exceptional 58.6% |
| Pennsylvania Germans | 99.7 /100 | #69 | Exceptional 58.5% |
| Italians | 99.6 /100 | #70 | Exceptional 58.4% |
| Bangladeshis | 99.6 /100 | #71 | Exceptional 58.4% |
| Austrians | 99.6 /100 | #72 | Exceptional 58.4% |
| Bolivians | 99.6 /100 | #73 | Exceptional 58.3% |
| Immigrants | Afghanistan | 99.6 /100 | #74 | Exceptional 58.3% |
| Poles | 99.5 /100 | #75 | Exceptional 58.3% |
| Creek | 99.5 /100 | #76 | Exceptional 58.3% |
| Slovenes | 99.5 /100 | #77 | Exceptional 58.3% |
| Lithuanians | 99.5 /100 | #78 | Exceptional 58.2% |
| Delaware | 99.4 /100 | #79 | Exceptional 58.2% |
| Immigrants | England | 99.3 /100 | #80 | Exceptional 58.1% |
| Immigrants | Iraq | 99.3 /100 | #81 | Exceptional 58.1% |