Immigrants from Lithuania vs Immigrants from Asia 2 or more Vehicles in Household
COMPARE
Immigrants from Lithuania
Immigrants from Asia
2 or more Vehicles in Household
2 or more Vehicles in Household Comparison
Immigrants from Lithuania
Immigrants from Asia
55.8%
2 OR MORE VEHICLES IN HOUSEHOLD
70.4/ 100
METRIC RATING
156th/ 347
METRIC RANK
56.3%
2 OR MORE VEHICLES IN HOUSEHOLD
86.0/ 100
METRIC RATING
136th/ 347
METRIC RANK
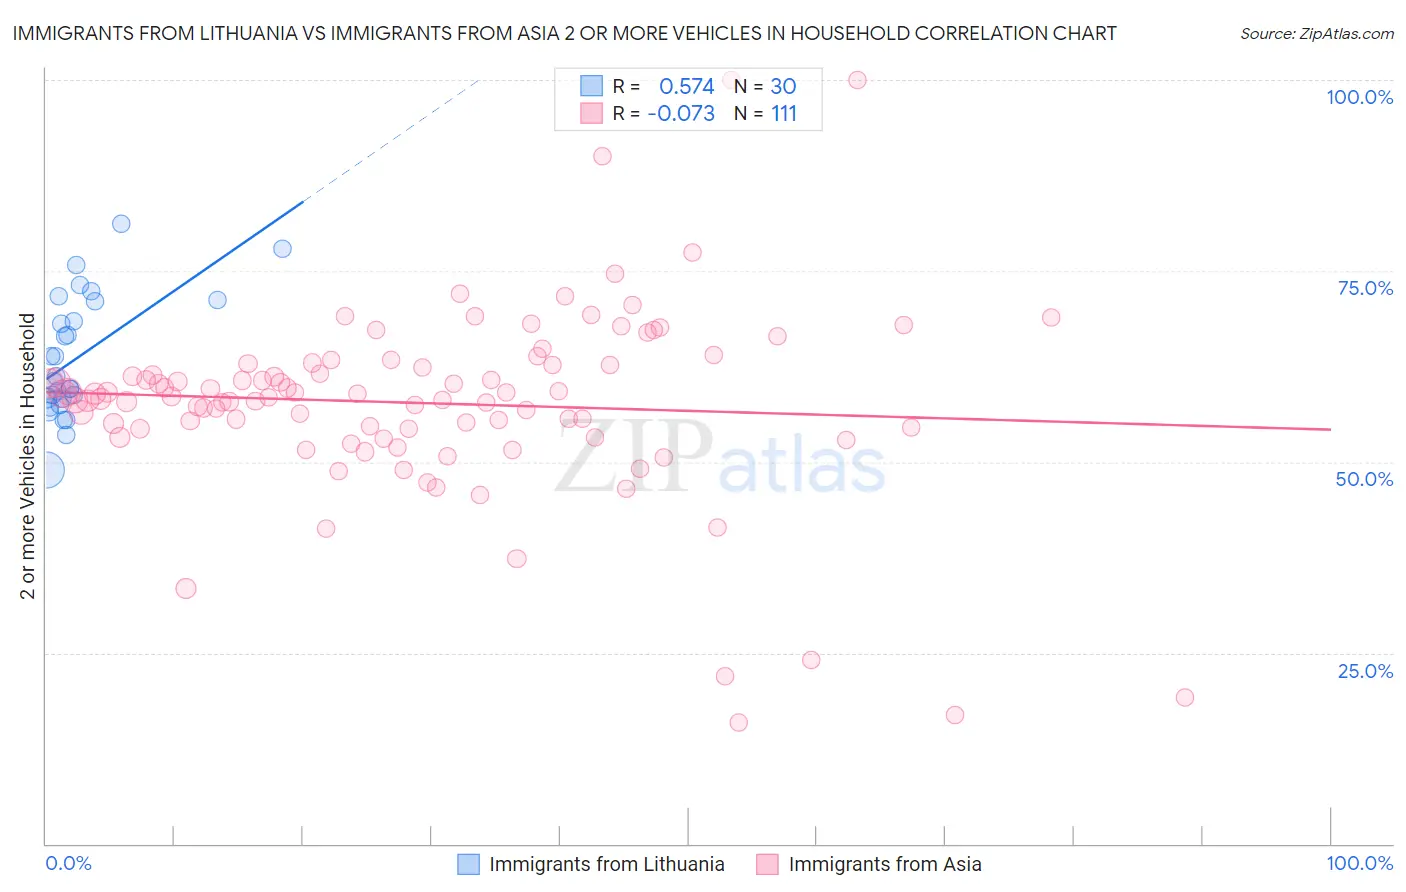
Immigrants from Lithuania vs Immigrants from Asia 2 or more Vehicles in Household Correlation Chart
The statistical analysis conducted on geographies consisting of 117,713,976 people shows a substantial positive correlation between the proportion of Immigrants from Lithuania and percentage of households with 2 or more vehicles available in the United States with a correlation coefficient (R) of 0.574 and weighted average of 55.8%. Similarly, the statistical analysis conducted on geographies consisting of 548,501,460 people shows a slight negative correlation between the proportion of Immigrants from Asia and percentage of households with 2 or more vehicles available in the United States with a correlation coefficient (R) of -0.073 and weighted average of 56.3%, a difference of 0.93%.
2 or more Vehicles in Household Correlation Summary
| Measurement | Immigrants from Lithuania | Immigrants from Asia |
| Minimum | 49.0% | 15.8% |
| Maximum | 81.2% | 100.0% |
| Range | 32.3% | 84.2% |
| Mean | 63.7% | 57.7% |
| Median | 60.9% | 58.5% |
| Interquartile 25% (IQ1) | 58.2% | 54.4% |
| Interquartile 75% (IQ3) | 71.1% | 62.7% |
| Interquartile Range (IQR) | 12.9% | 8.2% |
| Standard Deviation (Sample) | 7.9% | 12.7% |
| Standard Deviation (Population) | 7.8% | 12.6% |
Demographics Similar to Immigrants from Lithuania and Immigrants from Asia by 2 or more Vehicles in Household
In terms of 2 or more vehicles in household, the demographic groups most similar to Immigrants from Lithuania are Immigrants from Venezuela (55.8%, a difference of 0.010%), Ukrainian (55.8%, a difference of 0.020%), Lumbee (55.9%, a difference of 0.070%), Immigrants from Pakistan (56.1%, a difference of 0.40%), and Immigrants from Northern Europe (56.1%, a difference of 0.44%). Similarly, the demographic groups most similar to Immigrants from Asia are Cuban (56.3%, a difference of 0.090%), Salvadoran (56.3%, a difference of 0.10%), Armenian (56.3%, a difference of 0.13%), Latvian (56.2%, a difference of 0.18%), and Immigrants from Cambodia (56.2%, a difference of 0.19%).
| Demographics | Rating | Rank | 2 or more Vehicles in Household |
| Immigrants | Asia | 86.0 /100 | #136 | Excellent 56.3% |
| Cubans | 84.8 /100 | #137 | Excellent 56.3% |
| Salvadorans | 84.7 /100 | #138 | Excellent 56.3% |
| Armenians | 84.3 /100 | #139 | Excellent 56.3% |
| Latvians | 83.6 /100 | #140 | Excellent 56.2% |
| Immigrants | Cambodia | 83.6 /100 | #141 | Excellent 56.2% |
| South Africans | 83.1 /100 | #142 | Excellent 56.2% |
| Seminole | 81.7 /100 | #143 | Excellent 56.2% |
| Immigrants | Syria | 81.4 /100 | #144 | Excellent 56.2% |
| Syrians | 81.2 /100 | #145 | Excellent 56.2% |
| Venezuelans | 80.7 /100 | #146 | Excellent 56.1% |
| Serbians | 80.3 /100 | #147 | Excellent 56.1% |
| Immigrants | Moldova | 80.2 /100 | #148 | Excellent 56.1% |
| Chileans | 80.2 /100 | #149 | Excellent 56.1% |
| Nicaraguans | 79.9 /100 | #150 | Good 56.1% |
| Immigrants | Northern Europe | 78.7 /100 | #151 | Good 56.1% |
| Immigrants | Pakistan | 78.1 /100 | #152 | Good 56.1% |
| Lumbee | 71.9 /100 | #153 | Good 55.9% |
| Ukrainians | 70.8 /100 | #154 | Good 55.8% |
| Immigrants | Venezuela | 70.7 /100 | #155 | Good 55.8% |
| Immigrants | Lithuania | 70.4 /100 | #156 | Good 55.8% |