Immigrants from Liberia vs Immigrants from Panama 1 or more Vehicles in Household
COMPARE
Immigrants from Liberia
Immigrants from Panama
1 or more Vehicles in Household
1 or more Vehicles in Household Comparison
Immigrants from Liberia
Immigrants from Panama
87.8%
1 OR MORE VEHICLES IN HOUSEHOLD
0.4/ 100
METRIC RATING
264th/ 347
METRIC RANK
85.4%
1 OR MORE VEHICLES IN HOUSEHOLD
0.0/ 100
METRIC RATING
301st/ 347
METRIC RANK
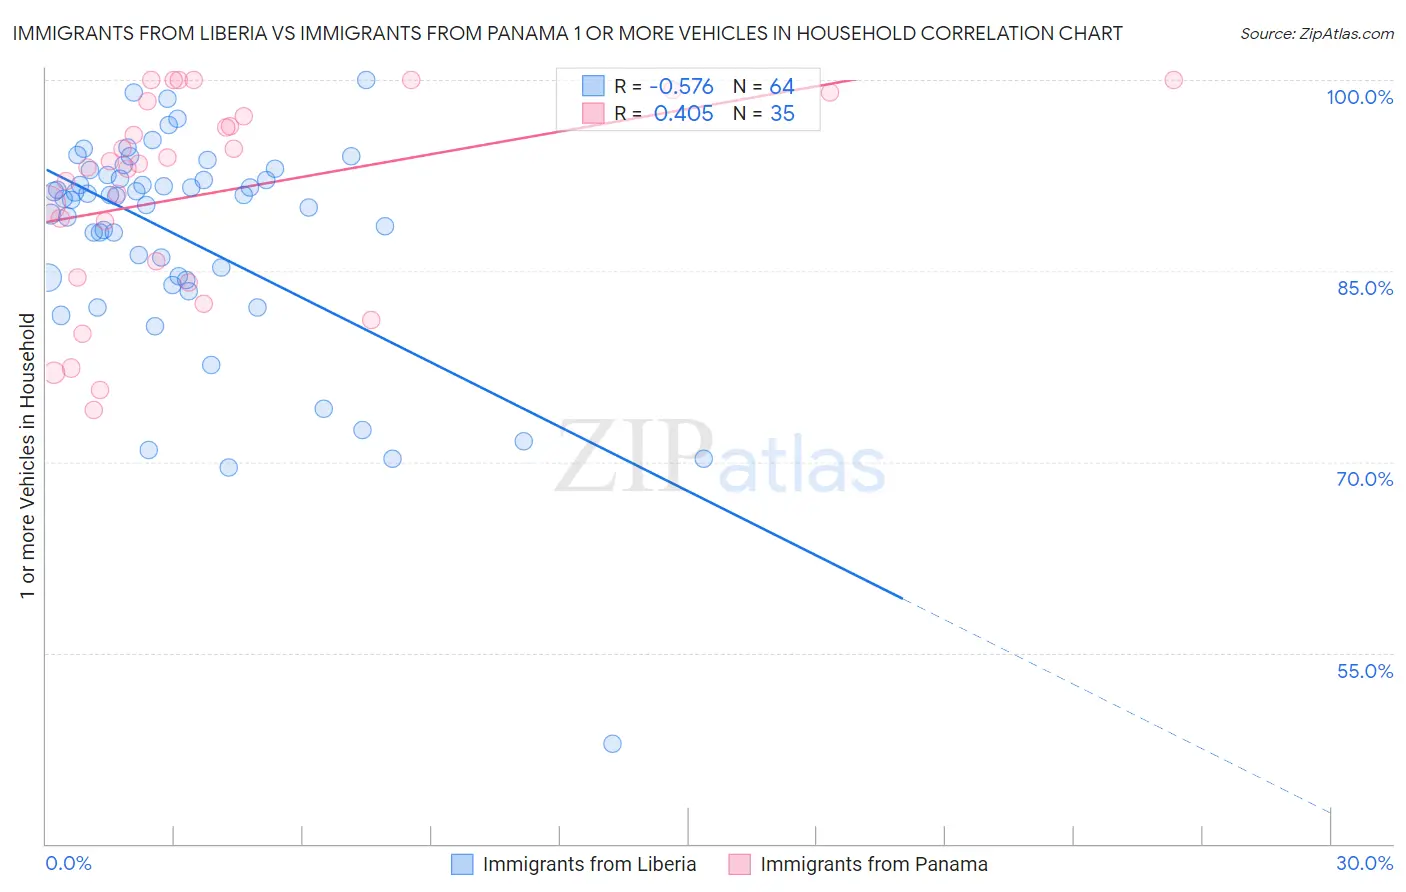
Immigrants from Liberia vs Immigrants from Panama 1 or more Vehicles in Household Correlation Chart
The statistical analysis conducted on geographies consisting of 135,251,590 people shows a substantial negative correlation between the proportion of Immigrants from Liberia and percentage of households with 1 or more vehicles available in the United States with a correlation coefficient (R) of -0.576 and weighted average of 87.8%. Similarly, the statistical analysis conducted on geographies consisting of 221,156,465 people shows a moderate positive correlation between the proportion of Immigrants from Panama and percentage of households with 1 or more vehicles available in the United States with a correlation coefficient (R) of 0.405 and weighted average of 85.4%, a difference of 2.8%.
1 or more Vehicles in Household Correlation Summary
| Measurement | Immigrants from Liberia | Immigrants from Panama |
| Minimum | 47.9% | 74.0% |
| Maximum | 100.0% | 100.0% |
| Range | 52.1% | 26.0% |
| Mean | 87.5% | 91.2% |
| Median | 90.7% | 93.4% |
| Interquartile 25% (IQ1) | 84.4% | 84.4% |
| Interquartile 75% (IQ3) | 92.3% | 98.3% |
| Interquartile Range (IQR) | 8.0% | 13.9% |
| Standard Deviation (Sample) | 9.0% | 8.0% |
| Standard Deviation (Population) | 8.9% | 7.9% |
Similar Demographics by 1 or more Vehicles in Household
Demographics Similar to Immigrants from Liberia by 1 or more Vehicles in Household
In terms of 1 or more vehicles in household, the demographic groups most similar to Immigrants from Liberia are Immigrants from Egypt (87.8%, a difference of 0.010%), African (87.8%, a difference of 0.020%), Subsaharan African (87.9%, a difference of 0.080%), Immigrants from Switzerland (87.9%, a difference of 0.11%), and Macedonian (87.9%, a difference of 0.15%).
| Demographics | Rating | Rank | 1 or more Vehicles in Household |
| Liberians | 0.9 /100 | #257 | Tragic 88.0% |
| South American Indians | 0.9 /100 | #258 | Tragic 88.0% |
| Nigerians | 0.8 /100 | #259 | Tragic 88.0% |
| Macedonians | 0.6 /100 | #260 | Tragic 87.9% |
| Immigrants | Switzerland | 0.6 /100 | #261 | Tragic 87.9% |
| Sub-Saharan Africans | 0.5 /100 | #262 | Tragic 87.9% |
| Immigrants | Egypt | 0.5 /100 | #263 | Tragic 87.8% |
| Immigrants | Liberia | 0.4 /100 | #264 | Tragic 87.8% |
| Africans | 0.4 /100 | #265 | Tragic 87.8% |
| Israelis | 0.3 /100 | #266 | Tragic 87.7% |
| Immigrants | Colombia | 0.3 /100 | #267 | Tragic 87.6% |
| Immigrants | Europe | 0.2 /100 | #268 | Tragic 87.6% |
| Immigrants | Africa | 0.2 /100 | #269 | Tragic 87.6% |
| Panamanians | 0.2 /100 | #270 | Tragic 87.5% |
| Bermudans | 0.2 /100 | #271 | Tragic 87.5% |
Demographics Similar to Immigrants from Panama by 1 or more Vehicles in Household
In terms of 1 or more vehicles in household, the demographic groups most similar to Immigrants from Panama are Moroccan (85.4%, a difference of 0.020%), Immigrants from Russia (85.4%, a difference of 0.040%), Yuman (85.5%, a difference of 0.050%), Immigrants from Greece (85.4%, a difference of 0.050%), and Immigrants from Ukraine (85.2%, a difference of 0.22%).
| Demographics | Rating | Rank | 1 or more Vehicles in Household |
| Alaskan Athabascans | 0.0 /100 | #294 | Tragic 86.0% |
| Immigrants | Jamaica | 0.0 /100 | #295 | Tragic 85.8% |
| Immigrants | Spain | 0.0 /100 | #296 | Tragic 85.8% |
| Paraguayans | 0.0 /100 | #297 | Tragic 85.7% |
| Belizeans | 0.0 /100 | #298 | Tragic 85.7% |
| Yuman | 0.0 /100 | #299 | Tragic 85.5% |
| Immigrants | Russia | 0.0 /100 | #300 | Tragic 85.4% |
| Immigrants | Panama | 0.0 /100 | #301 | Tragic 85.4% |
| Moroccans | 0.0 /100 | #302 | Tragic 85.4% |
| Immigrants | Greece | 0.0 /100 | #303 | Tragic 85.4% |
| Immigrants | Ukraine | 0.0 /100 | #304 | Tragic 85.2% |
| Immigrants | China | 0.0 /100 | #305 | Tragic 84.9% |
| Immigrants | Western Africa | 0.0 /100 | #306 | Tragic 84.9% |
| Tohono O'odham | 0.0 /100 | #307 | Tragic 84.7% |
| Immigrants | Belize | 0.0 /100 | #308 | Tragic 84.7% |