Polish vs Immigrants from Panama 1 or more Vehicles in Household
COMPARE
Polish
Immigrants from Panama
1 or more Vehicles in Household
1 or more Vehicles in Household Comparison
Poles
Immigrants from Panama
91.7%
1 OR MORE VEHICLES IN HOUSEHOLD
99.7/ 100
METRIC RATING
71st/ 347
METRIC RANK
85.4%
1 OR MORE VEHICLES IN HOUSEHOLD
0.0/ 100
METRIC RATING
301st/ 347
METRIC RANK
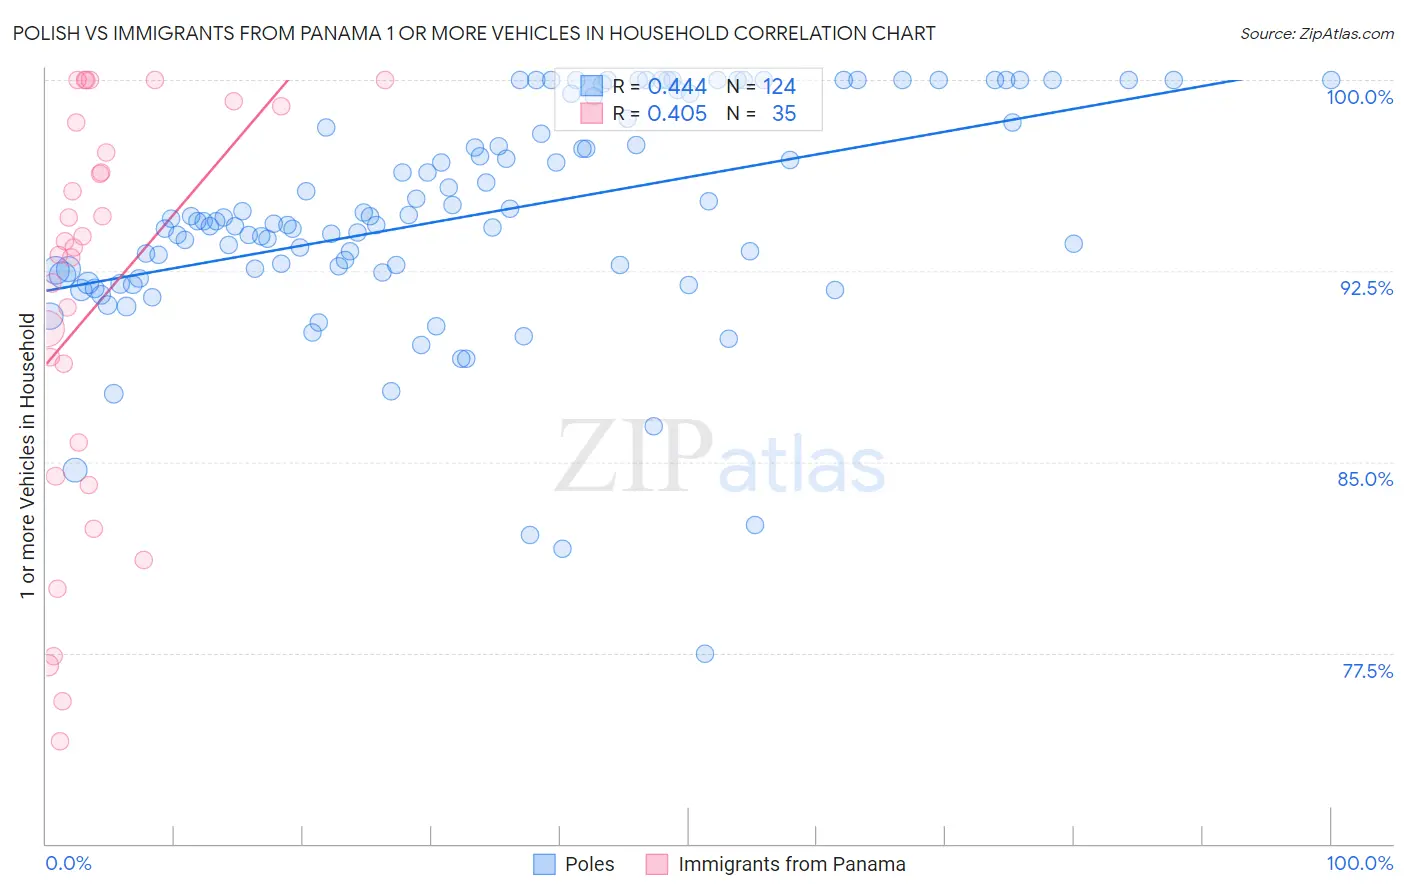
Polish vs Immigrants from Panama 1 or more Vehicles in Household Correlation Chart
The statistical analysis conducted on geographies consisting of 560,073,045 people shows a moderate positive correlation between the proportion of Poles and percentage of households with 1 or more vehicles available in the United States with a correlation coefficient (R) of 0.444 and weighted average of 91.7%. Similarly, the statistical analysis conducted on geographies consisting of 221,156,465 people shows a moderate positive correlation between the proportion of Immigrants from Panama and percentage of households with 1 or more vehicles available in the United States with a correlation coefficient (R) of 0.405 and weighted average of 85.4%, a difference of 7.3%.
1 or more Vehicles in Household Correlation Summary
| Measurement | Polish | Immigrants from Panama |
| Minimum | 77.5% | 74.0% |
| Maximum | 100.0% | 100.0% |
| Range | 22.5% | 26.0% |
| Mean | 94.7% | 91.2% |
| Median | 94.4% | 93.4% |
| Interquartile 25% (IQ1) | 92.5% | 84.4% |
| Interquartile 75% (IQ3) | 98.4% | 98.3% |
| Interquartile Range (IQR) | 5.9% | 13.9% |
| Standard Deviation (Sample) | 4.4% | 8.0% |
| Standard Deviation (Population) | 4.4% | 7.9% |
Similar Demographics by 1 or more Vehicles in Household
Demographics Similar to Poles by 1 or more Vehicles in Household
In terms of 1 or more vehicles in household, the demographic groups most similar to Poles are Cajun (91.7%, a difference of 0.0%), Immigrants from Iran (91.7%, a difference of 0.010%), Lithuanian (91.7%, a difference of 0.020%), Palestinian (91.7%, a difference of 0.040%), and Immigrants from Lebanon (91.6%, a difference of 0.050%).
| Demographics | Rating | Rank | 1 or more Vehicles in Household |
| Croatians | 99.8 /100 | #64 | Exceptional 91.9% |
| Immigrants | Laos | 99.8 /100 | #65 | Exceptional 91.8% |
| Canadians | 99.8 /100 | #66 | Exceptional 91.8% |
| Spaniards | 99.8 /100 | #67 | Exceptional 91.8% |
| Immigrants | Scotland | 99.7 /100 | #68 | Exceptional 91.8% |
| Palestinians | 99.7 /100 | #69 | Exceptional 91.7% |
| Lithuanians | 99.7 /100 | #70 | Exceptional 91.7% |
| Poles | 99.7 /100 | #71 | Exceptional 91.7% |
| Cajuns | 99.7 /100 | #72 | Exceptional 91.7% |
| Immigrants | Iran | 99.7 /100 | #73 | Exceptional 91.7% |
| Immigrants | Lebanon | 99.6 /100 | #74 | Exceptional 91.6% |
| Portuguese | 99.5 /100 | #75 | Exceptional 91.6% |
| Cubans | 99.5 /100 | #76 | Exceptional 91.5% |
| Immigrants | Philippines | 99.4 /100 | #77 | Exceptional 91.5% |
| Iranians | 99.4 /100 | #78 | Exceptional 91.5% |
Demographics Similar to Immigrants from Panama by 1 or more Vehicles in Household
In terms of 1 or more vehicles in household, the demographic groups most similar to Immigrants from Panama are Moroccan (85.4%, a difference of 0.020%), Immigrants from Russia (85.4%, a difference of 0.040%), Yuman (85.5%, a difference of 0.050%), Immigrants from Greece (85.4%, a difference of 0.050%), and Immigrants from Ukraine (85.2%, a difference of 0.22%).
| Demographics | Rating | Rank | 1 or more Vehicles in Household |
| Alaskan Athabascans | 0.0 /100 | #294 | Tragic 86.0% |
| Immigrants | Jamaica | 0.0 /100 | #295 | Tragic 85.8% |
| Immigrants | Spain | 0.0 /100 | #296 | Tragic 85.8% |
| Paraguayans | 0.0 /100 | #297 | Tragic 85.7% |
| Belizeans | 0.0 /100 | #298 | Tragic 85.7% |
| Yuman | 0.0 /100 | #299 | Tragic 85.5% |
| Immigrants | Russia | 0.0 /100 | #300 | Tragic 85.4% |
| Immigrants | Panama | 0.0 /100 | #301 | Tragic 85.4% |
| Moroccans | 0.0 /100 | #302 | Tragic 85.4% |
| Immigrants | Greece | 0.0 /100 | #303 | Tragic 85.4% |
| Immigrants | Ukraine | 0.0 /100 | #304 | Tragic 85.2% |
| Immigrants | China | 0.0 /100 | #305 | Tragic 84.9% |
| Immigrants | Western Africa | 0.0 /100 | #306 | Tragic 84.9% |
| Tohono O'odham | 0.0 /100 | #307 | Tragic 84.7% |
| Immigrants | Belize | 0.0 /100 | #308 | Tragic 84.7% |