Cypriot vs Immigrants from Panama 1 or more Vehicles in Household
COMPARE
Cypriot
Immigrants from Panama
1 or more Vehicles in Household
1 or more Vehicles in Household Comparison
Cypriots
Immigrants from Panama
84.4%
1 OR MORE VEHICLES IN HOUSEHOLD
0.0/ 100
METRIC RATING
315th/ 347
METRIC RANK
85.4%
1 OR MORE VEHICLES IN HOUSEHOLD
0.0/ 100
METRIC RATING
301st/ 347
METRIC RANK
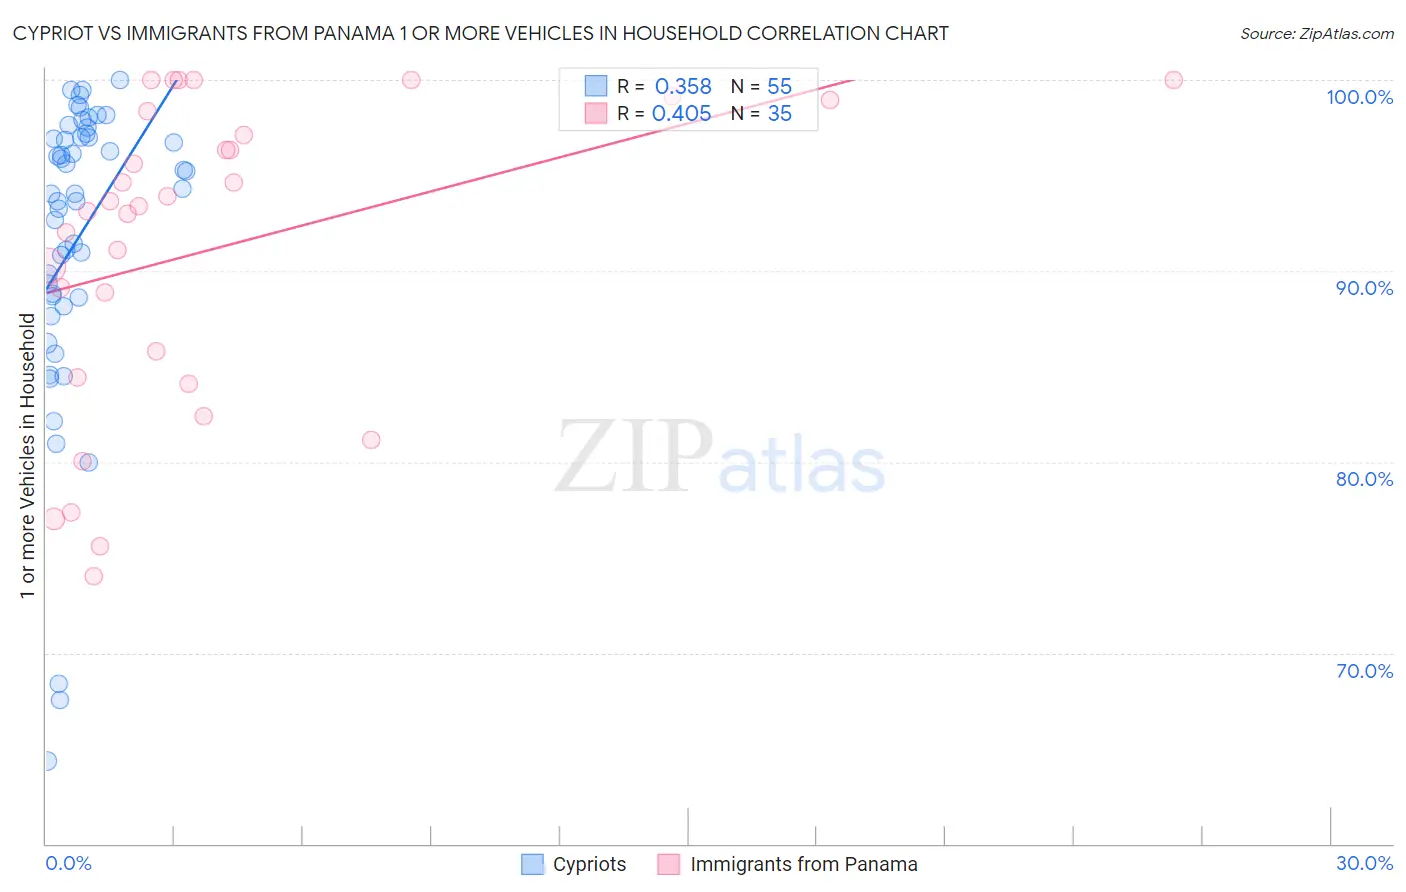
Cypriot vs Immigrants from Panama 1 or more Vehicles in Household Correlation Chart
The statistical analysis conducted on geographies consisting of 61,854,678 people shows a mild positive correlation between the proportion of Cypriots and percentage of households with 1 or more vehicles available in the United States with a correlation coefficient (R) of 0.358 and weighted average of 84.4%. Similarly, the statistical analysis conducted on geographies consisting of 221,156,465 people shows a moderate positive correlation between the proportion of Immigrants from Panama and percentage of households with 1 or more vehicles available in the United States with a correlation coefficient (R) of 0.405 and weighted average of 85.4%, a difference of 1.2%.
1 or more Vehicles in Household Correlation Summary
| Measurement | Cypriot | Immigrants from Panama |
| Minimum | 64.3% | 74.0% |
| Maximum | 100.0% | 100.0% |
| Range | 35.7% | 26.0% |
| Mean | 91.6% | 91.2% |
| Median | 94.0% | 93.4% |
| Interquartile 25% (IQ1) | 88.6% | 84.4% |
| Interquartile 75% (IQ3) | 97.0% | 98.3% |
| Interquartile Range (IQR) | 8.4% | 13.9% |
| Standard Deviation (Sample) | 8.0% | 8.0% |
| Standard Deviation (Population) | 7.9% | 7.9% |
Demographics Similar to Cypriots and Immigrants from Panama by 1 or more Vehicles in Household
In terms of 1 or more vehicles in household, the demographic groups most similar to Cypriots are Albanian (84.4%, a difference of 0.070%), Immigrants from Israel (84.5%, a difference of 0.13%), Cape Verdean (84.5%, a difference of 0.16%), Puerto Rican (84.6%, a difference of 0.27%), and U.S. Virgin Islander (84.6%, a difference of 0.30%). Similarly, the demographic groups most similar to Immigrants from Panama are Moroccan (85.4%, a difference of 0.020%), Immigrants from Russia (85.4%, a difference of 0.040%), Yuman (85.5%, a difference of 0.050%), Immigrants from Greece (85.4%, a difference of 0.050%), and Immigrants from Ukraine (85.2%, a difference of 0.22%).
| Demographics | Rating | Rank | 1 or more Vehicles in Household |
| Belizeans | 0.0 /100 | #298 | Tragic 85.7% |
| Yuman | 0.0 /100 | #299 | Tragic 85.5% |
| Immigrants | Russia | 0.0 /100 | #300 | Tragic 85.4% |
| Immigrants | Panama | 0.0 /100 | #301 | Tragic 85.4% |
| Moroccans | 0.0 /100 | #302 | Tragic 85.4% |
| Immigrants | Greece | 0.0 /100 | #303 | Tragic 85.4% |
| Immigrants | Ukraine | 0.0 /100 | #304 | Tragic 85.2% |
| Immigrants | China | 0.0 /100 | #305 | Tragic 84.9% |
| Immigrants | Western Africa | 0.0 /100 | #306 | Tragic 84.9% |
| Tohono O'odham | 0.0 /100 | #307 | Tragic 84.7% |
| Immigrants | Belize | 0.0 /100 | #308 | Tragic 84.7% |
| Immigrants | Haiti | 0.0 /100 | #309 | Tragic 84.7% |
| U.S. Virgin Islanders | 0.0 /100 | #310 | Tragic 84.6% |
| Puerto Ricans | 0.0 /100 | #311 | Tragic 84.6% |
| Cape Verdeans | 0.0 /100 | #312 | Tragic 84.5% |
| Immigrants | Israel | 0.0 /100 | #313 | Tragic 84.5% |
| Albanians | 0.0 /100 | #314 | Tragic 84.4% |
| Cypriots | 0.0 /100 | #315 | Tragic 84.4% |
| Alaska Natives | 0.0 /100 | #316 | Tragic 83.8% |
| Ghanaians | 0.0 /100 | #317 | Tragic 83.6% |
| Immigrants | Ghana | 0.0 /100 | #318 | Tragic 83.4% |