Immigrants from Liberia vs Slavic 1 or more Vehicles in Household
COMPARE
Immigrants from Liberia
Slavic
1 or more Vehicles in Household
1 or more Vehicles in Household Comparison
Immigrants from Liberia
Slavs
87.8%
1 OR MORE VEHICLES IN HOUSEHOLD
0.4/ 100
METRIC RATING
264th/ 347
METRIC RANK
91.2%
1 OR MORE VEHICLES IN HOUSEHOLD
98.7/ 100
METRIC RATING
98th/ 347
METRIC RANK
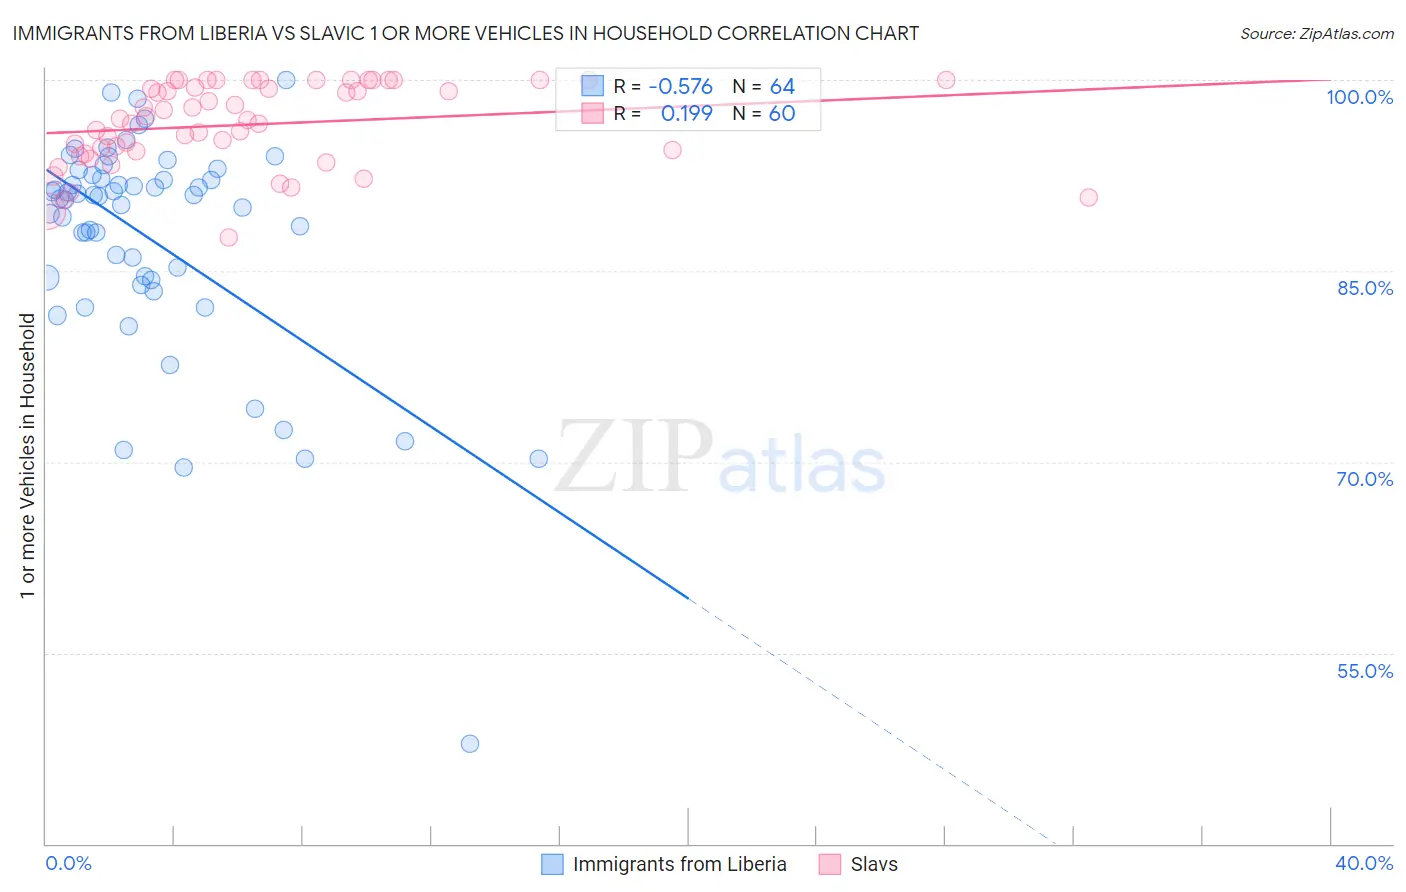
Immigrants from Liberia vs Slavic 1 or more Vehicles in Household Correlation Chart
The statistical analysis conducted on geographies consisting of 135,251,590 people shows a substantial negative correlation between the proportion of Immigrants from Liberia and percentage of households with 1 or more vehicles available in the United States with a correlation coefficient (R) of -0.576 and weighted average of 87.8%. Similarly, the statistical analysis conducted on geographies consisting of 270,821,380 people shows a poor positive correlation between the proportion of Slavs and percentage of households with 1 or more vehicles available in the United States with a correlation coefficient (R) of 0.199 and weighted average of 91.2%, a difference of 3.9%.
1 or more Vehicles in Household Correlation Summary
| Measurement | Immigrants from Liberia | Slavic |
| Minimum | 47.9% | 87.6% |
| Maximum | 100.0% | 100.0% |
| Range | 52.1% | 12.4% |
| Mean | 87.5% | 96.5% |
| Median | 90.7% | 96.9% |
| Interquartile 25% (IQ1) | 84.4% | 94.3% |
| Interquartile 75% (IQ3) | 92.3% | 99.7% |
| Interquartile Range (IQR) | 8.0% | 5.4% |
| Standard Deviation (Sample) | 9.0% | 3.3% |
| Standard Deviation (Population) | 8.9% | 3.2% |
Similar Demographics by 1 or more Vehicles in Household
Demographics Similar to Immigrants from Liberia by 1 or more Vehicles in Household
In terms of 1 or more vehicles in household, the demographic groups most similar to Immigrants from Liberia are Immigrants from Egypt (87.8%, a difference of 0.010%), African (87.8%, a difference of 0.020%), Subsaharan African (87.9%, a difference of 0.080%), Immigrants from Switzerland (87.9%, a difference of 0.11%), and Macedonian (87.9%, a difference of 0.15%).
| Demographics | Rating | Rank | 1 or more Vehicles in Household |
| Liberians | 0.9 /100 | #257 | Tragic 88.0% |
| South American Indians | 0.9 /100 | #258 | Tragic 88.0% |
| Nigerians | 0.8 /100 | #259 | Tragic 88.0% |
| Macedonians | 0.6 /100 | #260 | Tragic 87.9% |
| Immigrants | Switzerland | 0.6 /100 | #261 | Tragic 87.9% |
| Sub-Saharan Africans | 0.5 /100 | #262 | Tragic 87.9% |
| Immigrants | Egypt | 0.5 /100 | #263 | Tragic 87.8% |
| Immigrants | Liberia | 0.4 /100 | #264 | Tragic 87.8% |
| Africans | 0.4 /100 | #265 | Tragic 87.8% |
| Israelis | 0.3 /100 | #266 | Tragic 87.7% |
| Immigrants | Colombia | 0.3 /100 | #267 | Tragic 87.6% |
| Immigrants | Europe | 0.2 /100 | #268 | Tragic 87.6% |
| Immigrants | Africa | 0.2 /100 | #269 | Tragic 87.6% |
| Panamanians | 0.2 /100 | #270 | Tragic 87.5% |
| Bermudans | 0.2 /100 | #271 | Tragic 87.5% |
Demographics Similar to Slavs by 1 or more Vehicles in Household
In terms of 1 or more vehicles in household, the demographic groups most similar to Slavs are Immigrants from Bolivia (91.2%, a difference of 0.020%), Immigrants from Central America (91.1%, a difference of 0.060%), Bulgarian (91.1%, a difference of 0.070%), Seminole (91.1%, a difference of 0.090%), and Yugoslavian (91.1%, a difference of 0.10%).
| Demographics | Rating | Rank | 1 or more Vehicles in Household |
| Immigrants | Jordan | 99.2 /100 | #91 | Exceptional 91.4% |
| Bhutanese | 99.2 /100 | #92 | Exceptional 91.4% |
| Immigrants | North America | 99.2 /100 | #93 | Exceptional 91.4% |
| Immigrants | Cuba | 99.1 /100 | #94 | Exceptional 91.3% |
| Austrians | 99.0 /100 | #95 | Exceptional 91.3% |
| Potawatomi | 99.0 /100 | #96 | Exceptional 91.3% |
| Pakistanis | 99.0 /100 | #97 | Exceptional 91.3% |
| Slavs | 98.7 /100 | #98 | Exceptional 91.2% |
| Immigrants | Bolivia | 98.6 /100 | #99 | Exceptional 91.2% |
| Immigrants | Central America | 98.4 /100 | #100 | Exceptional 91.1% |
| Bulgarians | 98.4 /100 | #101 | Exceptional 91.1% |
| Seminole | 98.3 /100 | #102 | Exceptional 91.1% |
| Yugoslavians | 98.3 /100 | #103 | Exceptional 91.1% |
| Asians | 98.2 /100 | #104 | Exceptional 91.1% |
| Laotians | 98.0 /100 | #105 | Exceptional 91.0% |