Immigrants from Liberia vs American 2 or more Vehicles in Household
COMPARE
Immigrants from Liberia
American
2 or more Vehicles in Household
2 or more Vehicles in Household Comparison
Immigrants from Liberia
Americans
51.3%
2 OR MORE VEHICLES IN HOUSEHOLD
0.1/ 100
METRIC RATING
286th/ 347
METRIC RANK
60.0%
2 OR MORE VEHICLES IN HOUSEHOLD
100.0/ 100
METRIC RATING
38th/ 347
METRIC RANK
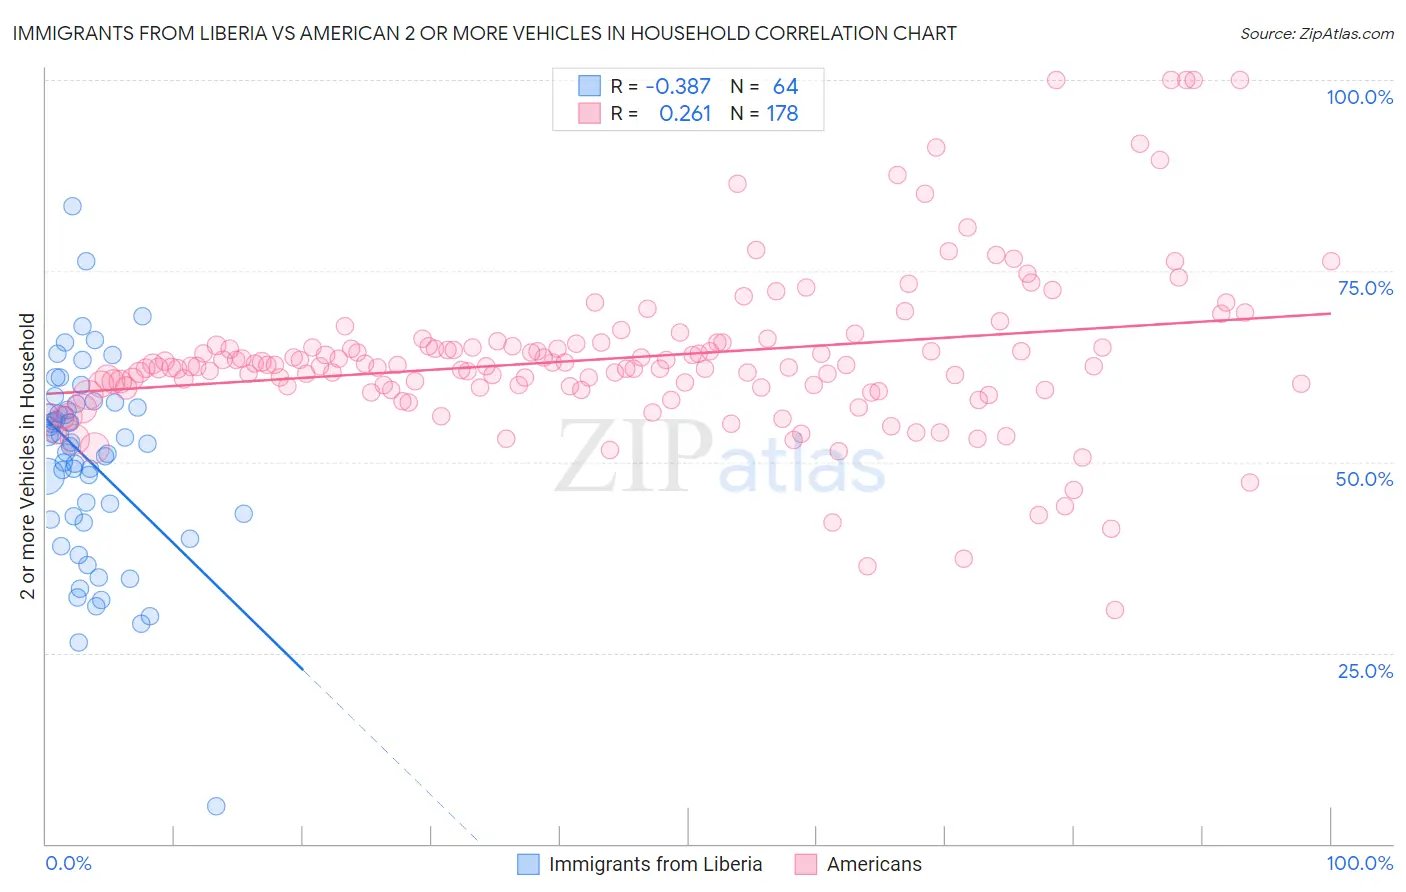
Immigrants from Liberia vs American 2 or more Vehicles in Household Correlation Chart
The statistical analysis conducted on geographies consisting of 135,251,590 people shows a mild negative correlation between the proportion of Immigrants from Liberia and percentage of households with 2 or more vehicles available in the United States with a correlation coefficient (R) of -0.387 and weighted average of 51.3%. Similarly, the statistical analysis conducted on geographies consisting of 581,432,617 people shows a weak positive correlation between the proportion of Americans and percentage of households with 2 or more vehicles available in the United States with a correlation coefficient (R) of 0.261 and weighted average of 60.0%, a difference of 17.0%.
2 or more Vehicles in Household Correlation Summary
| Measurement | Immigrants from Liberia | American |
| Minimum | 4.9% | 30.7% |
| Maximum | 83.5% | 100.0% |
| Range | 78.6% | 69.3% |
| Mean | 50.3% | 63.6% |
| Median | 52.4% | 62.5% |
| Interquartile 25% (IQ1) | 42.7% | 59.7% |
| Interquartile 75% (IQ3) | 57.4% | 65.2% |
| Interquartile Range (IQR) | 14.7% | 5.6% |
| Standard Deviation (Sample) | 13.0% | 10.7% |
| Standard Deviation (Population) | 12.9% | 10.7% |
Similar Demographics by 2 or more Vehicles in Household
Demographics Similar to Immigrants from Liberia by 2 or more Vehicles in Household
In terms of 2 or more vehicles in household, the demographic groups most similar to Immigrants from Liberia are Immigrants from Serbia (51.3%, a difference of 0.020%), Immigrants from Uruguay (51.4%, a difference of 0.14%), Okinawan (51.2%, a difference of 0.14%), Immigrants from Zaire (51.5%, a difference of 0.30%), and Immigrants from China (51.5%, a difference of 0.34%).
| Demographics | Rating | Rank | 2 or more Vehicles in Household |
| Liberians | 0.1 /100 | #279 | Tragic 51.7% |
| Immigrants | Eastern Europe | 0.1 /100 | #280 | Tragic 51.7% |
| Immigrants | Kazakhstan | 0.1 /100 | #281 | Tragic 51.6% |
| Bahamians | 0.1 /100 | #282 | Tragic 51.5% |
| Immigrants | China | 0.1 /100 | #283 | Tragic 51.5% |
| Immigrants | Zaire | 0.1 /100 | #284 | Tragic 51.5% |
| Immigrants | Uruguay | 0.1 /100 | #285 | Tragic 51.4% |
| Immigrants | Liberia | 0.1 /100 | #286 | Tragic 51.3% |
| Immigrants | Serbia | 0.1 /100 | #287 | Tragic 51.3% |
| Okinawans | 0.1 /100 | #288 | Tragic 51.2% |
| Somalis | 0.0 /100 | #289 | Tragic 51.1% |
| Immigrants | Panama | 0.0 /100 | #290 | Tragic 51.1% |
| Belizeans | 0.0 /100 | #291 | Tragic 51.0% |
| Immigrants | Ukraine | 0.0 /100 | #292 | Tragic 50.9% |
| Blacks/African Americans | 0.0 /100 | #293 | Tragic 50.9% |
Demographics Similar to Americans by 2 or more Vehicles in Household
In terms of 2 or more vehicles in household, the demographic groups most similar to Americans are British (60.0%, a difference of 0.0%), Irish (60.1%, a difference of 0.060%), Chinese (60.1%, a difference of 0.10%), Immigrants from Philippines (60.1%, a difference of 0.12%), and Spanish (60.2%, a difference of 0.24%).
| Demographics | Rating | Rank | 2 or more Vehicles in Household |
| Spanish American Indians | 100.0 /100 | #31 | Exceptional 60.3% |
| Arapaho | 100.0 /100 | #32 | Exceptional 60.2% |
| Immigrants | Mexico | 100.0 /100 | #33 | Exceptional 60.2% |
| Spanish | 100.0 /100 | #34 | Exceptional 60.2% |
| Immigrants | Philippines | 100.0 /100 | #35 | Exceptional 60.1% |
| Chinese | 100.0 /100 | #36 | Exceptional 60.1% |
| Irish | 100.0 /100 | #37 | Exceptional 60.1% |
| Americans | 100.0 /100 | #38 | Exceptional 60.0% |
| British | 100.0 /100 | #39 | Exceptional 60.0% |
| Cherokee | 100.0 /100 | #40 | Exceptional 59.9% |
| Northern Europeans | 100.0 /100 | #41 | Exceptional 59.9% |
| Malaysians | 100.0 /100 | #42 | Exceptional 59.8% |
| Czechoslovakians | 100.0 /100 | #43 | Exceptional 59.8% |
| French | 100.0 /100 | #44 | Exceptional 59.8% |
| Immigrants | Taiwan | 100.0 /100 | #45 | Exceptional 59.7% |