Immigrants from Liberia vs Immigrants from Canada Disability Age 65 to 74
COMPARE
Immigrants from Liberia
Immigrants from Canada
Disability Age 65 to 74
Disability Age 65 to 74 Comparison
Immigrants from Liberia
Immigrants from Canada
25.7%
DISABILITY AGE 65 TO 74
0.1/ 100
METRIC RATING
271st/ 347
METRIC RANK
22.1%
DISABILITY AGE 65 TO 74
97.8/ 100
METRIC RATING
93rd/ 347
METRIC RANK
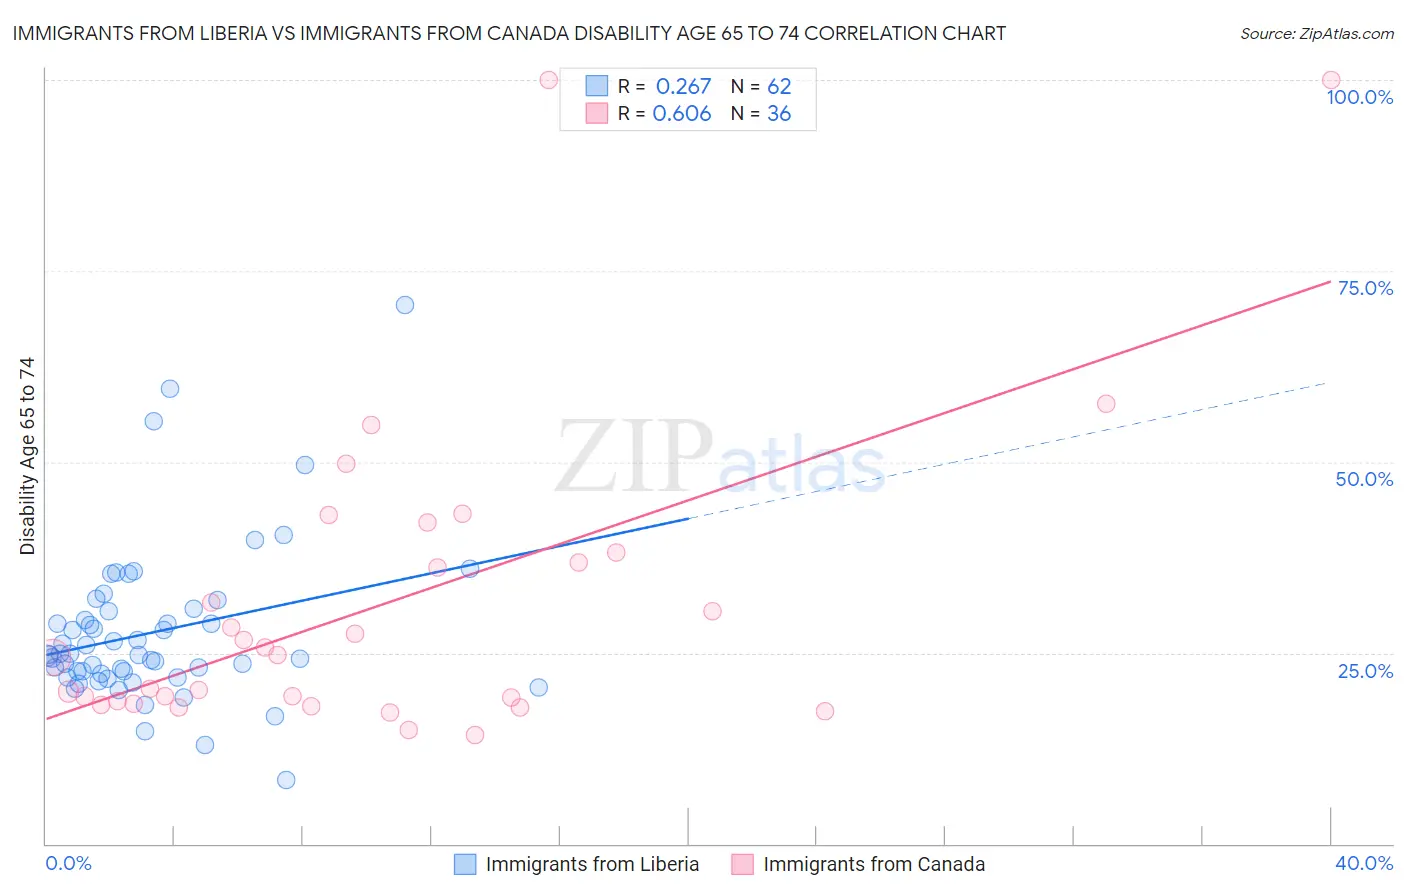
Immigrants from Liberia vs Immigrants from Canada Disability Age 65 to 74 Correlation Chart
The statistical analysis conducted on geographies consisting of 135,108,092 people shows a weak positive correlation between the proportion of Immigrants from Liberia and percentage of population with a disability between the ages 65 and 75 in the United States with a correlation coefficient (R) of 0.267 and weighted average of 25.7%. Similarly, the statistical analysis conducted on geographies consisting of 458,545,659 people shows a significant positive correlation between the proportion of Immigrants from Canada and percentage of population with a disability between the ages 65 and 75 in the United States with a correlation coefficient (R) of 0.606 and weighted average of 22.1%, a difference of 16.5%.
Disability Age 65 to 74 Correlation Summary
| Measurement | Immigrants from Liberia | Immigrants from Canada |
| Minimum | 8.3% | 14.3% |
| Maximum | 70.5% | 100.0% |
| Range | 62.1% | 85.7% |
| Mean | 27.6% | 31.4% |
| Median | 24.7% | 24.6% |
| Interquartile 25% (IQ1) | 22.2% | 18.5% |
| Interquartile 75% (IQ3) | 30.4% | 37.4% |
| Interquartile Range (IQR) | 8.2% | 18.9% |
| Standard Deviation (Sample) | 10.4% | 20.4% |
| Standard Deviation (Population) | 10.3% | 20.2% |
Similar Demographics by Disability Age 65 to 74
Demographics Similar to Immigrants from Liberia by Disability Age 65 to 74
In terms of disability age 65 to 74, the demographic groups most similar to Immigrants from Liberia are Immigrants from Dominica (25.7%, a difference of 0.0%), Immigrants from Guatemala (25.7%, a difference of 0.030%), Hmong (25.7%, a difference of 0.11%), Japanese (25.7%, a difference of 0.13%), and Liberian (25.6%, a difference of 0.23%).
| Demographics | Rating | Rank | Disability Age 65 to 74 |
| Hawaiians | 0.2 /100 | #264 | Tragic 25.5% |
| Guatemalans | 0.2 /100 | #265 | Tragic 25.5% |
| Immigrants | Latin America | 0.1 /100 | #266 | Tragic 25.6% |
| Ottawa | 0.1 /100 | #267 | Tragic 25.6% |
| Liberians | 0.1 /100 | #268 | Tragic 25.6% |
| Hmong | 0.1 /100 | #269 | Tragic 25.7% |
| Immigrants | Guatemala | 0.1 /100 | #270 | Tragic 25.7% |
| Immigrants | Liberia | 0.1 /100 | #271 | Tragic 25.7% |
| Immigrants | Dominica | 0.1 /100 | #272 | Tragic 25.7% |
| Japanese | 0.1 /100 | #273 | Tragic 25.7% |
| Americans | 0.1 /100 | #274 | Tragic 25.8% |
| Hondurans | 0.1 /100 | #275 | Tragic 25.8% |
| French American Indians | 0.1 /100 | #276 | Tragic 25.8% |
| Belizeans | 0.1 /100 | #277 | Tragic 25.8% |
| Immigrants | Belize | 0.1 /100 | #278 | Tragic 25.8% |
Demographics Similar to Immigrants from Canada by Disability Age 65 to 74
In terms of disability age 65 to 74, the demographic groups most similar to Immigrants from Canada are Immigrants from Chile (22.1%, a difference of 0.020%), Polish (22.0%, a difference of 0.030%), Chilean (22.0%, a difference of 0.080%), Romanian (22.1%, a difference of 0.080%), and Italian (22.0%, a difference of 0.10%).
| Demographics | Rating | Rank | Disability Age 65 to 74 |
| South Africans | 98.4 /100 | #86 | Exceptional 21.9% |
| Australians | 98.0 /100 | #87 | Exceptional 22.0% |
| Immigrants | Netherlands | 97.9 /100 | #88 | Exceptional 22.0% |
| Immigrants | Kuwait | 97.9 /100 | #89 | Exceptional 22.0% |
| Italians | 97.9 /100 | #90 | Exceptional 22.0% |
| Chileans | 97.9 /100 | #91 | Exceptional 22.0% |
| Poles | 97.8 /100 | #92 | Exceptional 22.0% |
| Immigrants | Canada | 97.8 /100 | #93 | Exceptional 22.1% |
| Immigrants | Chile | 97.7 /100 | #94 | Exceptional 22.1% |
| Romanians | 97.7 /100 | #95 | Exceptional 22.1% |
| Immigrants | North America | 97.5 /100 | #96 | Exceptional 22.1% |
| Immigrants | Southern Europe | 97.2 /100 | #97 | Exceptional 22.1% |
| Jordanians | 96.9 /100 | #98 | Exceptional 22.2% |
| Immigrants | Colombia | 96.8 /100 | #99 | Exceptional 22.2% |
| Uruguayans | 96.5 /100 | #100 | Exceptional 22.2% |