Immigrants from Albania vs Comanche 1 or more Vehicles in Household
COMPARE
Immigrants from Albania
Comanche
1 or more Vehicles in Household
1 or more Vehicles in Household Comparison
Immigrants from Albania
Comanche
87.1%
1 OR MORE VEHICLES IN HOUSEHOLD
0.1/ 100
METRIC RATING
279th/ 347
METRIC RANK
89.9%
1 OR MORE VEHICLES IN HOUSEHOLD
63.4/ 100
METRIC RATING
164th/ 347
METRIC RANK
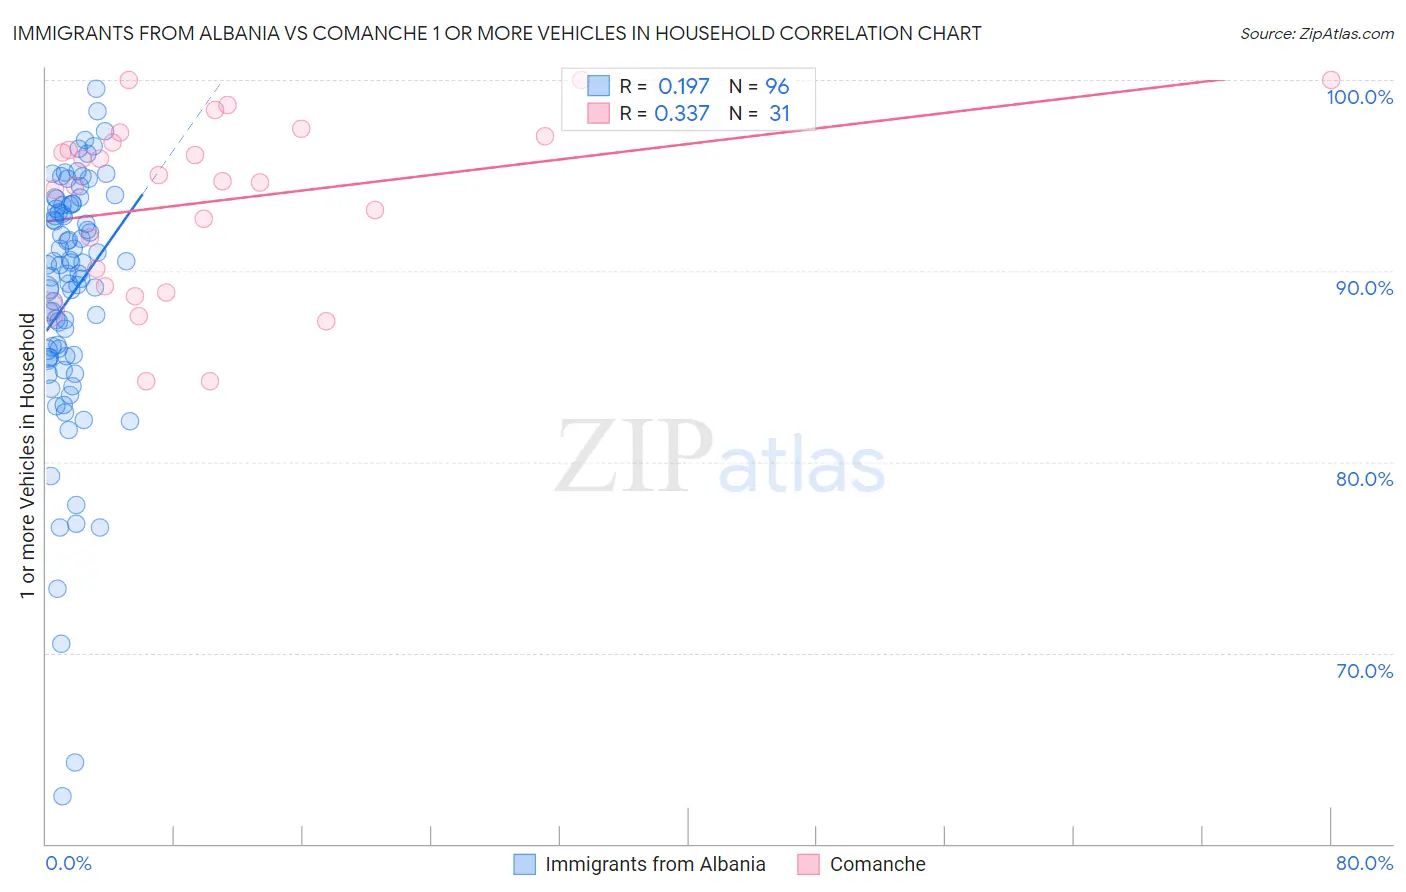
Immigrants from Albania vs Comanche 1 or more Vehicles in Household Correlation Chart
The statistical analysis conducted on geographies consisting of 107,656,140 people shows a poor positive correlation between the proportion of Immigrants from Albania and percentage of households with 1 or more vehicles available in the United States with a correlation coefficient (R) of 0.197 and weighted average of 87.1%. Similarly, the statistical analysis conducted on geographies consisting of 109,768,112 people shows a mild positive correlation between the proportion of Comanche and percentage of households with 1 or more vehicles available in the United States with a correlation coefficient (R) of 0.337 and weighted average of 89.9%, a difference of 3.3%.
1 or more Vehicles in Household Correlation Summary
| Measurement | Immigrants from Albania | Comanche |
| Minimum | 62.5% | 84.2% |
| Maximum | 99.5% | 100.0% |
| Range | 37.0% | 15.8% |
| Mean | 88.6% | 93.7% |
| Median | 90.1% | 94.7% |
| Interquartile 25% (IQ1) | 85.5% | 89.2% |
| Interquartile 75% (IQ3) | 93.3% | 97.1% |
| Interquartile Range (IQR) | 7.8% | 7.9% |
| Standard Deviation (Sample) | 6.7% | 4.6% |
| Standard Deviation (Population) | 6.7% | 4.5% |
Similar Demographics by 1 or more Vehicles in Household
Demographics Similar to Immigrants from Albania by 1 or more Vehicles in Household
In terms of 1 or more vehicles in household, the demographic groups most similar to Immigrants from Albania are Immigrants from Southern Europe (87.1%, a difference of 0.0%), Immigrants from Croatia (87.0%, a difference of 0.030%), Alsatian (87.1%, a difference of 0.040%), Mongolian (87.0%, a difference of 0.090%), and Immigrants from France (87.1%, a difference of 0.10%).
| Demographics | Rating | Rank | 1 or more Vehicles in Household |
| Aleuts | 0.2 /100 | #272 | Tragic 87.5% |
| Immigrants | Northern Africa | 0.2 /100 | #273 | Tragic 87.4% |
| Immigrants | Morocco | 0.1 /100 | #274 | Tragic 87.4% |
| Immigrants | Singapore | 0.1 /100 | #275 | Tragic 87.2% |
| Immigrants | France | 0.1 /100 | #276 | Tragic 87.1% |
| Alsatians | 0.1 /100 | #277 | Tragic 87.1% |
| Immigrants | Southern Europe | 0.1 /100 | #278 | Tragic 87.1% |
| Immigrants | Albania | 0.1 /100 | #279 | Tragic 87.1% |
| Immigrants | Croatia | 0.0 /100 | #280 | Tragic 87.0% |
| Mongolians | 0.0 /100 | #281 | Tragic 87.0% |
| Colville | 0.0 /100 | #282 | Tragic 86.8% |
| Immigrants | Eastern Europe | 0.0 /100 | #283 | Tragic 86.7% |
| Central American Indians | 0.0 /100 | #284 | Tragic 86.7% |
| Immigrants | Kazakhstan | 0.0 /100 | #285 | Tragic 86.6% |
| Immigrants | Eastern Asia | 0.0 /100 | #286 | Tragic 86.5% |
Demographics Similar to Comanche by 1 or more Vehicles in Household
In terms of 1 or more vehicles in household, the demographic groups most similar to Comanche are Immigrants from Saudi Arabia (89.9%, a difference of 0.010%), Immigrants from Middle Africa (89.9%, a difference of 0.020%), Immigrants from Austria (89.9%, a difference of 0.040%), Immigrants from Latin America (89.8%, a difference of 0.050%), and Immigrants from Cambodia (89.8%, a difference of 0.050%).
| Demographics | Rating | Rank | 1 or more Vehicles in Household |
| Immigrants | Congo | 71.2 /100 | #157 | Good 90.0% |
| Brazilians | 71.0 /100 | #158 | Good 90.0% |
| South Africans | 69.7 /100 | #159 | Good 90.0% |
| Immigrants | Indonesia | 68.8 /100 | #160 | Good 90.0% |
| Salvadorans | 68.7 /100 | #161 | Good 90.0% |
| Spanish American Indians | 67.0 /100 | #162 | Good 89.9% |
| Immigrants | Austria | 65.5 /100 | #163 | Good 89.9% |
| Comanche | 63.4 /100 | #164 | Good 89.9% |
| Immigrants | Saudi Arabia | 62.6 /100 | #165 | Good 89.9% |
| Immigrants | Middle Africa | 62.2 /100 | #166 | Good 89.9% |
| Immigrants | Latin America | 60.3 /100 | #167 | Good 89.8% |
| Immigrants | Cambodia | 60.1 /100 | #168 | Good 89.8% |
| Natives/Alaskans | 59.5 /100 | #169 | Average 89.8% |
| Immigrants | Costa Rica | 57.6 /100 | #170 | Average 89.8% |
| French American Indians | 54.4 /100 | #171 | Average 89.8% |