Immigrants from Lebanon vs Immigrants from Guyana Disability Age 65 to 74
COMPARE
Immigrants from Lebanon
Immigrants from Guyana
Disability Age 65 to 74
Disability Age 65 to 74 Comparison
Immigrants from Lebanon
Immigrants from Guyana
21.9%
DISABILITY AGE 65 TO 74
98.4/ 100
METRIC RATING
85th/ 347
METRIC RANK
23.6%
DISABILITY AGE 65 TO 74
31.2/ 100
METRIC RATING
190th/ 347
METRIC RANK
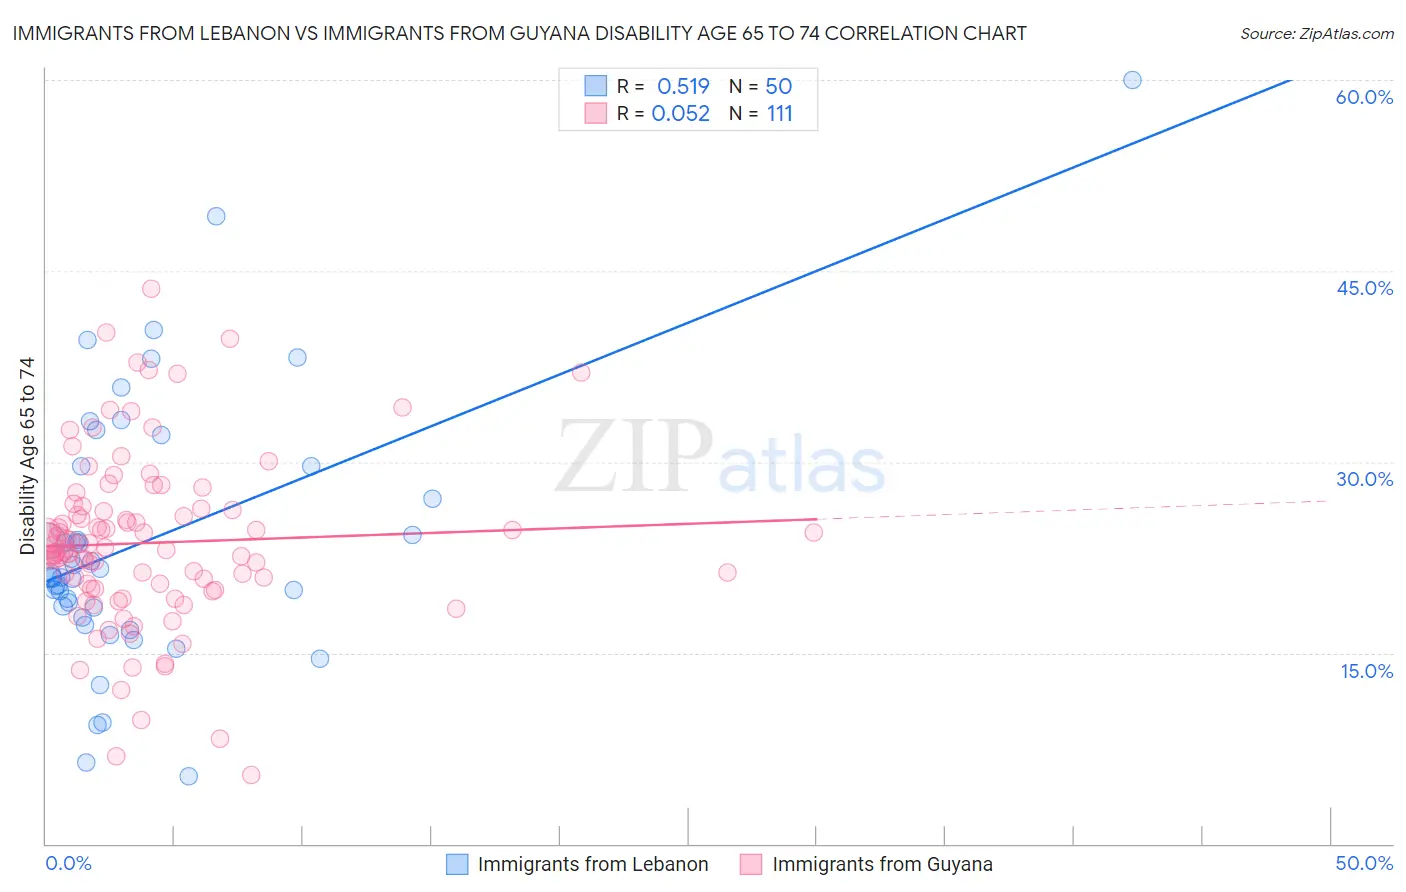
Immigrants from Lebanon vs Immigrants from Guyana Disability Age 65 to 74 Correlation Chart
The statistical analysis conducted on geographies consisting of 217,046,866 people shows a substantial positive correlation between the proportion of Immigrants from Lebanon and percentage of population with a disability between the ages 65 and 75 in the United States with a correlation coefficient (R) of 0.519 and weighted average of 21.9%. Similarly, the statistical analysis conducted on geographies consisting of 183,512,147 people shows a slight positive correlation between the proportion of Immigrants from Guyana and percentage of population with a disability between the ages 65 and 75 in the United States with a correlation coefficient (R) of 0.052 and weighted average of 23.6%, a difference of 7.6%.
Disability Age 65 to 74 Correlation Summary
| Measurement | Immigrants from Lebanon | Immigrants from Guyana |
| Minimum | 5.3% | 5.4% |
| Maximum | 60.0% | 43.6% |
| Range | 54.7% | 38.2% |
| Mean | 23.7% | 23.6% |
| Median | 21.0% | 23.1% |
| Interquartile 25% (IQ1) | 18.6% | 20.0% |
| Interquartile 75% (IQ3) | 29.6% | 26.2% |
| Interquartile Range (IQR) | 11.1% | 6.2% |
| Standard Deviation (Sample) | 10.4% | 6.7% |
| Standard Deviation (Population) | 10.2% | 6.6% |
Similar Demographics by Disability Age 65 to 74
Demographics Similar to Immigrants from Lebanon by Disability Age 65 to 74
In terms of disability age 65 to 74, the demographic groups most similar to Immigrants from Lebanon are South African (21.9%, a difference of 0.080%), Immigrants from Spain (21.9%, a difference of 0.10%), Immigrants from Brazil (21.9%, a difference of 0.12%), Immigrants from Indonesia (21.9%, a difference of 0.29%), and Australian (22.0%, a difference of 0.42%).
| Demographics | Rating | Rank | Disability Age 65 to 74 |
| Immigrants | Eastern Europe | 99.0 /100 | #78 | Exceptional 21.8% |
| Venezuelans | 99.0 /100 | #79 | Exceptional 21.8% |
| Immigrants | Norway | 98.9 /100 | #80 | Exceptional 21.8% |
| Croatians | 98.9 /100 | #81 | Exceptional 21.8% |
| Immigrants | Indonesia | 98.7 /100 | #82 | Exceptional 21.9% |
| Immigrants | Brazil | 98.5 /100 | #83 | Exceptional 21.9% |
| Immigrants | Spain | 98.5 /100 | #84 | Exceptional 21.9% |
| Immigrants | Lebanon | 98.4 /100 | #85 | Exceptional 21.9% |
| South Africans | 98.4 /100 | #86 | Exceptional 21.9% |
| Australians | 98.0 /100 | #87 | Exceptional 22.0% |
| Immigrants | Netherlands | 97.9 /100 | #88 | Exceptional 22.0% |
| Immigrants | Kuwait | 97.9 /100 | #89 | Exceptional 22.0% |
| Italians | 97.9 /100 | #90 | Exceptional 22.0% |
| Chileans | 97.9 /100 | #91 | Exceptional 22.0% |
| Poles | 97.8 /100 | #92 | Exceptional 22.0% |
Demographics Similar to Immigrants from Guyana by Disability Age 65 to 74
In terms of disability age 65 to 74, the demographic groups most similar to Immigrants from Guyana are Immigrants from Bangladesh (23.6%, a difference of 0.070%), Ecuadorian (23.6%, a difference of 0.10%), Scottish (23.6%, a difference of 0.12%), Immigrants from Cuba (23.6%, a difference of 0.18%), and English (23.6%, a difference of 0.19%).
| Demographics | Rating | Rank | Disability Age 65 to 74 |
| Immigrants | Eastern Africa | 42.8 /100 | #183 | Average 23.4% |
| Immigrants | Germany | 42.5 /100 | #184 | Average 23.4% |
| Haitians | 42.4 /100 | #185 | Average 23.4% |
| Basques | 38.4 /100 | #186 | Fair 23.5% |
| Portuguese | 37.8 /100 | #187 | Fair 23.5% |
| Immigrants | Cuba | 34.0 /100 | #188 | Fair 23.6% |
| Scottish | 33.1 /100 | #189 | Fair 23.6% |
| Immigrants | Guyana | 31.2 /100 | #190 | Fair 23.6% |
| Immigrants | Bangladesh | 30.2 /100 | #191 | Fair 23.6% |
| Ecuadorians | 29.7 /100 | #192 | Fair 23.6% |
| English | 28.5 /100 | #193 | Fair 23.6% |
| Sudanese | 27.8 /100 | #194 | Fair 23.7% |
| Immigrants | St. Vincent and the Grenadines | 26.1 /100 | #195 | Fair 23.7% |
| Immigrants | Trinidad and Tobago | 26.1 /100 | #196 | Fair 23.7% |
| Immigrants | Immigrants | 25.8 /100 | #197 | Fair 23.7% |