Immigrants from Kuwait vs Honduran 1 or more Vehicles in Household
COMPARE
Immigrants from Kuwait
Honduran
1 or more Vehicles in Household
1 or more Vehicles in Household Comparison
Immigrants from Kuwait
Hondurans
90.7%
1 OR MORE VEHICLES IN HOUSEHOLD
94.7/ 100
METRIC RATING
113th/ 347
METRIC RANK
88.1%
1 OR MORE VEHICLES IN HOUSEHOLD
1.0/ 100
METRIC RATING
253rd/ 347
METRIC RANK
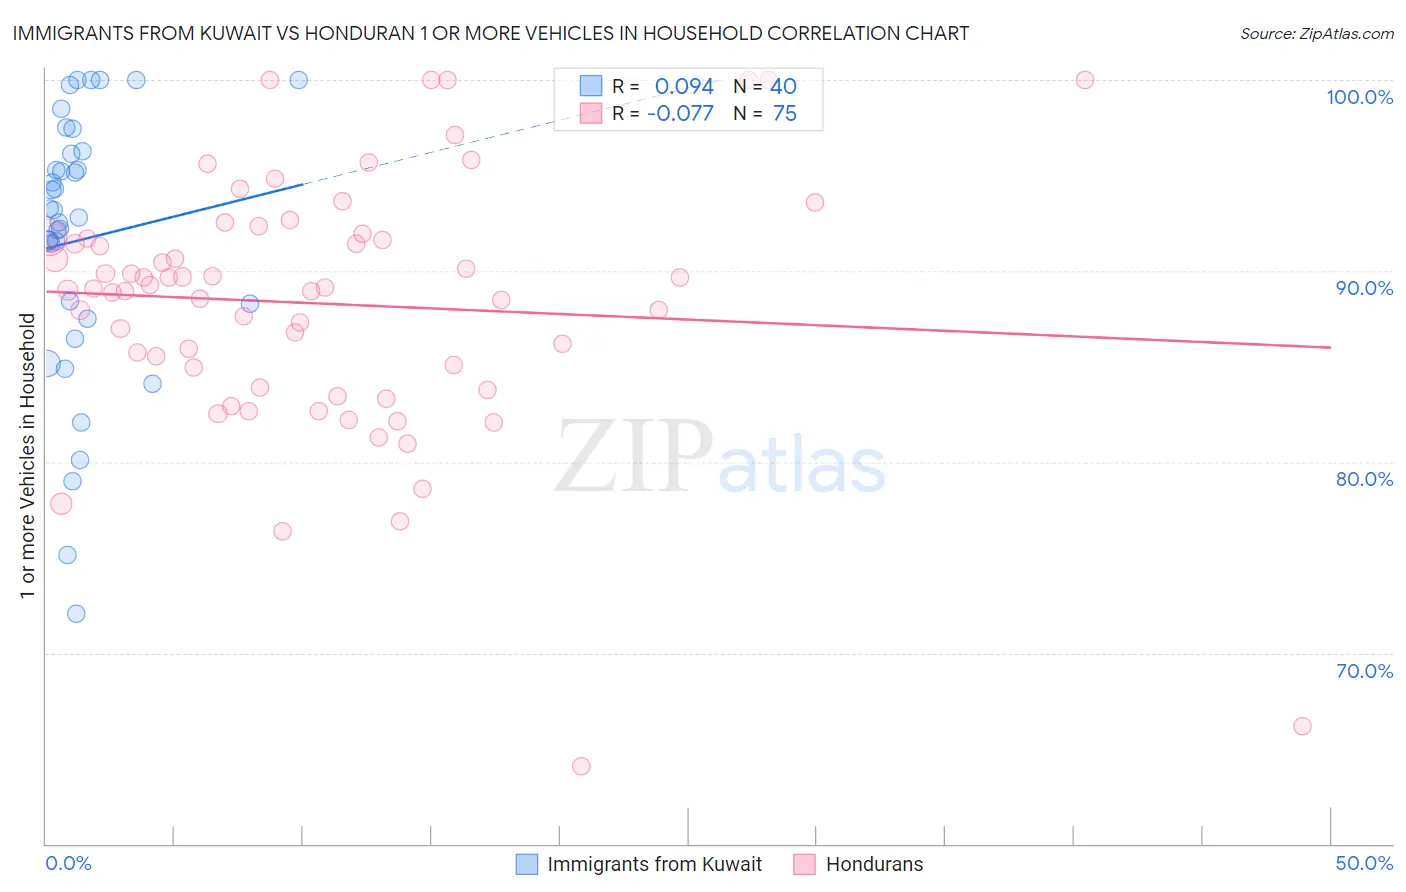
Immigrants from Kuwait vs Honduran 1 or more Vehicles in Household Correlation Chart
The statistical analysis conducted on geographies consisting of 136,852,839 people shows a slight positive correlation between the proportion of Immigrants from Kuwait and percentage of households with 1 or more vehicles available in the United States with a correlation coefficient (R) of 0.094 and weighted average of 90.7%. Similarly, the statistical analysis conducted on geographies consisting of 357,633,161 people shows a slight negative correlation between the proportion of Hondurans and percentage of households with 1 or more vehicles available in the United States with a correlation coefficient (R) of -0.077 and weighted average of 88.1%, a difference of 3.0%.
1 or more Vehicles in Household Correlation Summary
| Measurement | Immigrants from Kuwait | Honduran |
| Minimum | 72.1% | 64.1% |
| Maximum | 100.0% | 100.0% |
| Range | 27.9% | 35.9% |
| Mean | 91.6% | 88.3% |
| Median | 93.0% | 89.1% |
| Interquartile 25% (IQ1) | 87.9% | 83.9% |
| Interquartile 75% (IQ3) | 96.2% | 91.7% |
| Interquartile Range (IQR) | 8.3% | 7.8% |
| Standard Deviation (Sample) | 7.0% | 6.8% |
| Standard Deviation (Population) | 6.9% | 6.7% |
Similar Demographics by 1 or more Vehicles in Household
Demographics Similar to Immigrants from Kuwait by 1 or more Vehicles in Household
In terms of 1 or more vehicles in household, the demographic groups most similar to Immigrants from Kuwait are Armenian (90.7%, a difference of 0.020%), Serbian (90.7%, a difference of 0.030%), Chippewa (90.7%, a difference of 0.030%), Immigrants from Netherlands (90.8%, a difference of 0.080%), and Navajo (90.8%, a difference of 0.090%).
| Demographics | Rating | Rank | 1 or more Vehicles in Household |
| Zimbabweans | 97.7 /100 | #106 | Exceptional 91.0% |
| Maltese | 97.7 /100 | #107 | Exceptional 91.0% |
| Hispanics or Latinos | 97.6 /100 | #108 | Exceptional 91.0% |
| Delaware | 97.6 /100 | #109 | Exceptional 91.0% |
| Mexican American Indians | 97.4 /100 | #110 | Exceptional 91.0% |
| Navajo | 95.8 /100 | #111 | Exceptional 90.8% |
| Immigrants | Netherlands | 95.7 /100 | #112 | Exceptional 90.8% |
| Immigrants | Kuwait | 94.7 /100 | #113 | Exceptional 90.7% |
| Armenians | 94.5 /100 | #114 | Exceptional 90.7% |
| Serbians | 94.3 /100 | #115 | Exceptional 90.7% |
| Chippewa | 94.3 /100 | #116 | Exceptional 90.7% |
| Greeks | 93.5 /100 | #117 | Exceptional 90.6% |
| Japanese | 93.4 /100 | #118 | Exceptional 90.6% |
| Blackfeet | 92.6 /100 | #119 | Exceptional 90.6% |
| Immigrants | Thailand | 92.3 /100 | #120 | Exceptional 90.6% |
Demographics Similar to Hondurans by 1 or more Vehicles in Household
In terms of 1 or more vehicles in household, the demographic groups most similar to Hondurans are Haitian (88.1%, a difference of 0.010%), Immigrants from Uruguay (88.1%, a difference of 0.030%), Immigrants from Latvia (88.1%, a difference of 0.030%), Colombian (88.0%, a difference of 0.040%), and Liberian (88.0%, a difference of 0.040%).
| Demographics | Rating | Rank | 1 or more Vehicles in Household |
| Menominee | 1.9 /100 | #246 | Tragic 88.3% |
| Immigrants | Honduras | 1.7 /100 | #247 | Tragic 88.3% |
| Immigrants | Nigeria | 1.5 /100 | #248 | Tragic 88.2% |
| Blacks/African Americans | 1.4 /100 | #249 | Tragic 88.2% |
| Egyptians | 1.2 /100 | #250 | Tragic 88.2% |
| Immigrants | Serbia | 1.2 /100 | #251 | Tragic 88.2% |
| Immigrants | Uruguay | 1.1 /100 | #252 | Tragic 88.1% |
| Hondurans | 1.0 /100 | #253 | Tragic 88.1% |
| Haitians | 0.9 /100 | #254 | Tragic 88.1% |
| Immigrants | Latvia | 0.9 /100 | #255 | Tragic 88.1% |
| Colombians | 0.9 /100 | #256 | Tragic 88.0% |
| Liberians | 0.9 /100 | #257 | Tragic 88.0% |
| South American Indians | 0.9 /100 | #258 | Tragic 88.0% |
| Nigerians | 0.8 /100 | #259 | Tragic 88.0% |
| Macedonians | 0.6 /100 | #260 | Tragic 87.9% |