Immigrants from Kuwait vs Honduran Child Poverty Under the Age of 16
COMPARE
Immigrants from Kuwait
Honduran
Child Poverty Under the Age of 16
Child Poverty Under the Age of 16 Comparison
Immigrants from Kuwait
Hondurans
15.5%
CHILD POVERTY UNDER THE AGE OF 16
80.5/ 100
METRIC RATING
147th/ 347
METRIC RANK
22.2%
CHILD POVERTY UNDER THE AGE OF 16
0.0/ 100
METRIC RATING
322nd/ 347
METRIC RANK
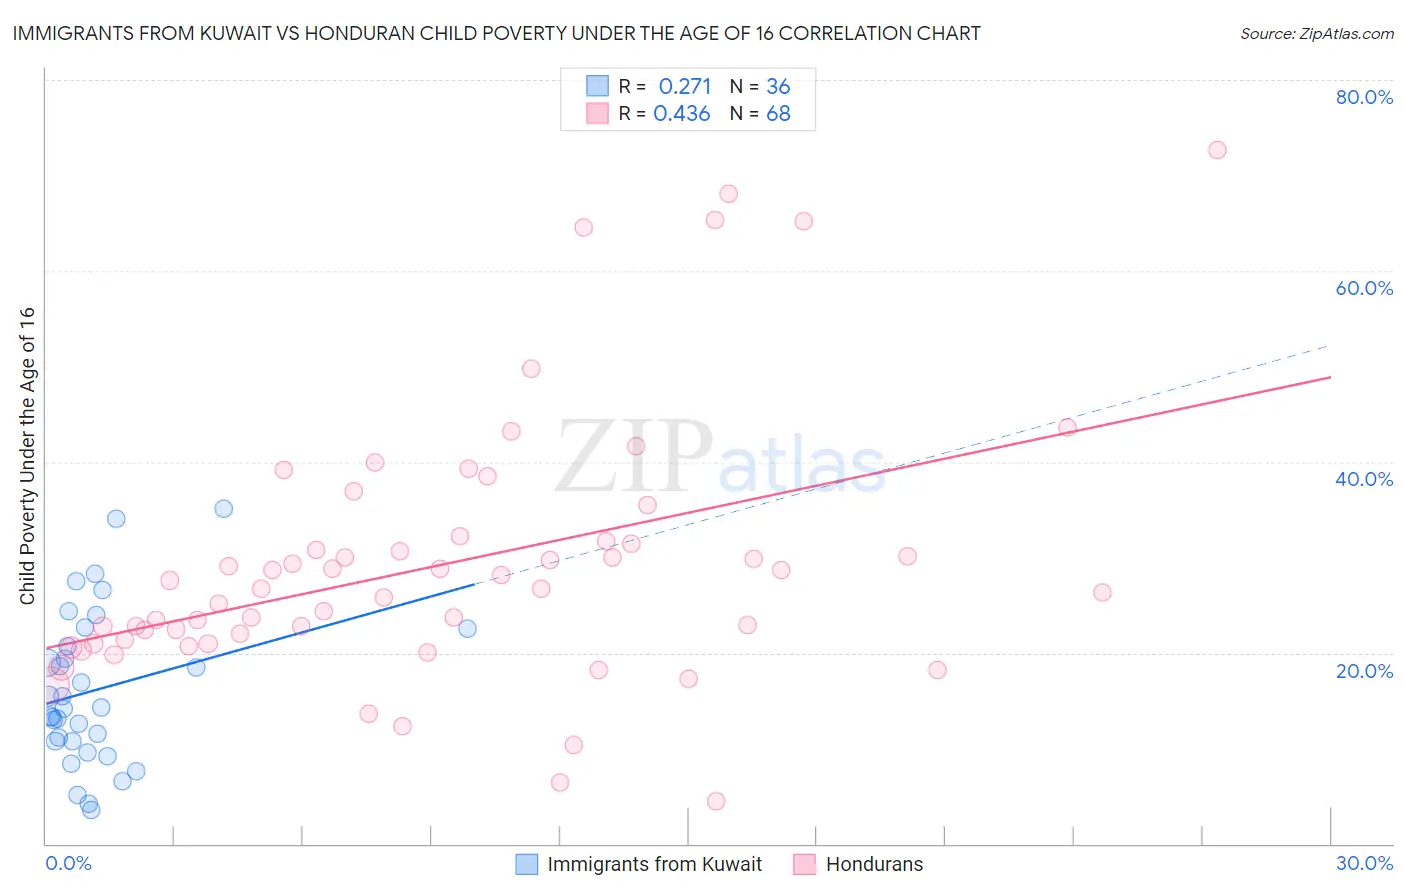
Immigrants from Kuwait vs Honduran Child Poverty Under the Age of 16 Correlation Chart
The statistical analysis conducted on geographies consisting of 136,641,121 people shows a weak positive correlation between the proportion of Immigrants from Kuwait and poverty level among children under the age of 16 in the United States with a correlation coefficient (R) of 0.271 and weighted average of 15.5%. Similarly, the statistical analysis conducted on geographies consisting of 356,140,791 people shows a moderate positive correlation between the proportion of Hondurans and poverty level among children under the age of 16 in the United States with a correlation coefficient (R) of 0.436 and weighted average of 22.2%, a difference of 43.1%.
Child Poverty Under the Age of 16 Correlation Summary
| Measurement | Immigrants from Kuwait | Honduran |
| Minimum | 3.5% | 4.4% |
| Maximum | 35.1% | 72.7% |
| Range | 31.6% | 68.3% |
| Mean | 16.1% | 29.2% |
| Median | 14.2% | 26.8% |
| Interquartile 25% (IQ1) | 10.7% | 21.2% |
| Interquartile 75% (IQ3) | 21.6% | 31.5% |
| Interquartile Range (IQR) | 10.9% | 10.4% |
| Standard Deviation (Sample) | 8.0% | 13.7% |
| Standard Deviation (Population) | 7.9% | 13.6% |
Similar Demographics by Child Poverty Under the Age of 16
Demographics Similar to Immigrants from Kuwait by Child Poverty Under the Age of 16
In terms of child poverty under the age of 16, the demographic groups most similar to Immigrants from Kuwait are Puget Sound Salish (15.5%, a difference of 0.030%), Israeli (15.5%, a difference of 0.070%), Slovak (15.5%, a difference of 0.19%), Immigrants from Peru (15.5%, a difference of 0.24%), and Immigrants from Hungary (15.5%, a difference of 0.29%).
| Demographics | Rating | Rank | Child Poverty Under the Age of 16 |
| New Zealanders | 86.9 /100 | #140 | Excellent 15.3% |
| Slavs | 84.2 /100 | #141 | Excellent 15.4% |
| Brazilians | 82.8 /100 | #142 | Excellent 15.4% |
| Icelanders | 82.5 /100 | #143 | Excellent 15.4% |
| Immigrants | Hungary | 81.9 /100 | #144 | Excellent 15.5% |
| Immigrants | Peru | 81.7 /100 | #145 | Excellent 15.5% |
| Slovaks | 81.4 /100 | #146 | Excellent 15.5% |
| Immigrants | Kuwait | 80.5 /100 | #147 | Excellent 15.5% |
| Puget Sound Salish | 80.3 /100 | #148 | Excellent 15.5% |
| Israelis | 80.1 /100 | #149 | Excellent 15.5% |
| Immigrants | Jordan | 78.5 /100 | #150 | Good 15.6% |
| French | 78.5 /100 | #151 | Good 15.6% |
| French Canadians | 78.2 /100 | #152 | Good 15.6% |
| Venezuelans | 77.4 /100 | #153 | Good 15.6% |
| Samoans | 77.3 /100 | #154 | Good 15.6% |
Demographics Similar to Hondurans by Child Poverty Under the Age of 16
In terms of child poverty under the age of 16, the demographic groups most similar to Hondurans are Kiowa (22.2%, a difference of 0.19%), Cajun (22.1%, a difference of 0.37%), Yakama (22.1%, a difference of 0.58%), Paiute (22.4%, a difference of 1.0%), and U.S. Virgin Islander (22.0%, a difference of 1.1%).
| Demographics | Rating | Rank | Child Poverty Under the Age of 16 |
| Immigrants | Guatemala | 0.0 /100 | #315 | Tragic 21.6% |
| Africans | 0.0 /100 | #316 | Tragic 21.7% |
| Immigrants | Dominica | 0.0 /100 | #317 | Tragic 21.9% |
| U.S. Virgin Islanders | 0.0 /100 | #318 | Tragic 22.0% |
| Yakama | 0.0 /100 | #319 | Tragic 22.1% |
| Cajuns | 0.0 /100 | #320 | Tragic 22.1% |
| Kiowa | 0.0 /100 | #321 | Tragic 22.2% |
| Hondurans | 0.0 /100 | #322 | Tragic 22.2% |
| Paiute | 0.0 /100 | #323 | Tragic 22.4% |
| Central American Indians | 0.0 /100 | #324 | Tragic 22.5% |
| Immigrants | Congo | 0.0 /100 | #325 | Tragic 22.5% |
| Immigrants | Honduras | 0.0 /100 | #326 | Tragic 22.7% |
| Menominee | 0.0 /100 | #327 | Tragic 23.0% |
| Colville | 0.0 /100 | #328 | Tragic 23.0% |
| Dominicans | 0.0 /100 | #329 | Tragic 23.8% |