Immigrants from Kuwait vs Honduran Family Households
COMPARE
Immigrants from Kuwait
Honduran
Family Households
Family Households Comparison
Immigrants from Kuwait
Hondurans
62.4%
FAMILY HOUSEHOLDS
0.0/ 100
METRIC RATING
299th/ 347
METRIC RANK
64.4%
FAMILY HOUSEHOLDS
57.5/ 100
METRIC RATING
168th/ 347
METRIC RANK
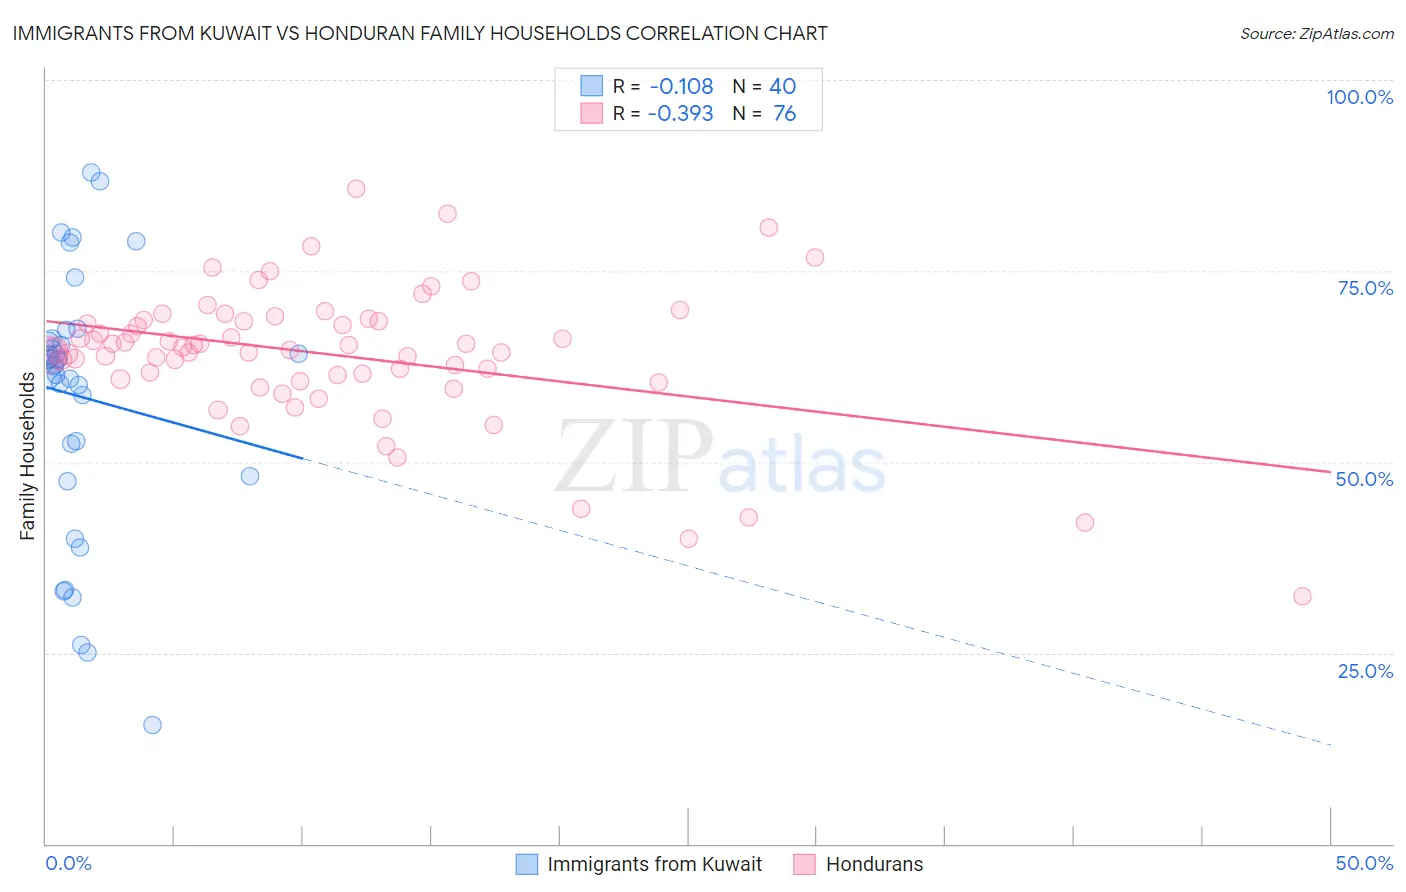
Immigrants from Kuwait vs Honduran Family Households Correlation Chart
The statistical analysis conducted on geographies consisting of 136,888,250 people shows a poor negative correlation between the proportion of Immigrants from Kuwait and percentage of family households in the United States with a correlation coefficient (R) of -0.108 and weighted average of 62.4%. Similarly, the statistical analysis conducted on geographies consisting of 357,606,635 people shows a mild negative correlation between the proportion of Hondurans and percentage of family households in the United States with a correlation coefficient (R) of -0.393 and weighted average of 64.4%, a difference of 3.2%.
Family Households Correlation Summary
| Measurement | Immigrants from Kuwait | Honduran |
| Minimum | 15.6% | 32.4% |
| Maximum | 87.9% | 85.8% |
| Range | 72.2% | 53.5% |
| Mean | 58.5% | 64.1% |
| Median | 63.0% | 64.8% |
| Interquartile 25% (IQ1) | 50.2% | 61.2% |
| Interquartile 75% (IQ3) | 66.0% | 68.5% |
| Interquartile Range (IQR) | 15.8% | 7.3% |
| Standard Deviation (Sample) | 17.0% | 9.1% |
| Standard Deviation (Population) | 16.8% | 9.0% |
Similar Demographics by Family Households
Demographics Similar to Immigrants from Kuwait by Family Households
In terms of family households, the demographic groups most similar to Immigrants from Kuwait are Immigrants from Africa (62.4%, a difference of 0.0%), Immigrants from Albania (62.4%, a difference of 0.030%), Immigrants from Spain (62.4%, a difference of 0.060%), Immigrants from Kenya (62.3%, a difference of 0.070%), and French American Indian (62.4%, a difference of 0.090%).
| Demographics | Rating | Rank | Family Households |
| Immigrants | Burma/Myanmar | 0.0 /100 | #292 | Tragic 62.6% |
| Immigrants | Sweden | 0.0 /100 | #293 | Tragic 62.5% |
| Barbadians | 0.0 /100 | #294 | Tragic 62.5% |
| Okinawans | 0.0 /100 | #295 | Tragic 62.5% |
| Slovenes | 0.0 /100 | #296 | Tragic 62.4% |
| French American Indians | 0.0 /100 | #297 | Tragic 62.4% |
| Immigrants | Spain | 0.0 /100 | #298 | Tragic 62.4% |
| Immigrants | Kuwait | 0.0 /100 | #299 | Tragic 62.4% |
| Immigrants | Africa | 0.0 /100 | #300 | Tragic 62.4% |
| Immigrants | Albania | 0.0 /100 | #301 | Tragic 62.4% |
| Immigrants | Kenya | 0.0 /100 | #302 | Tragic 62.3% |
| Cree | 0.0 /100 | #303 | Tragic 62.3% |
| Iroquois | 0.0 /100 | #304 | Tragic 62.2% |
| Bermudans | 0.0 /100 | #305 | Tragic 62.2% |
| Africans | 0.0 /100 | #306 | Tragic 62.1% |
Demographics Similar to Hondurans by Family Households
In terms of family households, the demographic groups most similar to Hondurans are Irish (64.4%, a difference of 0.010%), Scotch-Irish (64.4%, a difference of 0.020%), Iraqi (64.4%, a difference of 0.020%), Armenian (64.4%, a difference of 0.020%), and Immigrants from Nigeria (64.4%, a difference of 0.040%).
| Demographics | Rating | Rank | Family Households |
| Immigrants | England | 62.6 /100 | #161 | Good 64.4% |
| British | 61.6 /100 | #162 | Good 64.4% |
| Chickasaw | 61.5 /100 | #163 | Good 64.4% |
| Immigrants | Nigeria | 60.1 /100 | #164 | Good 64.4% |
| Immigrants | Southern Europe | 60.0 /100 | #165 | Good 64.4% |
| Scotch-Irish | 59.2 /100 | #166 | Average 64.4% |
| Irish | 57.9 /100 | #167 | Average 64.4% |
| Hondurans | 57.5 /100 | #168 | Average 64.4% |
| Iraqis | 56.0 /100 | #169 | Average 64.4% |
| Armenians | 55.9 /100 | #170 | Average 64.4% |
| Ute | 54.6 /100 | #171 | Average 64.3% |
| Dutch West Indians | 53.9 /100 | #172 | Average 64.3% |
| Immigrants | Sierra Leone | 52.5 /100 | #173 | Average 64.3% |
| Immigrants | Germany | 50.0 /100 | #174 | Average 64.3% |
| Bangladeshis | 44.3 /100 | #175 | Average 64.3% |