Immigrants from Kuwait vs Panamanian 1 or more Vehicles in Household
COMPARE
Immigrants from Kuwait
Panamanian
1 or more Vehicles in Household
1 or more Vehicles in Household Comparison
Immigrants from Kuwait
Panamanians
90.7%
1 OR MORE VEHICLES IN HOUSEHOLD
94.7/ 100
METRIC RATING
113th/ 347
METRIC RANK
87.5%
1 OR MORE VEHICLES IN HOUSEHOLD
0.2/ 100
METRIC RATING
270th/ 347
METRIC RANK
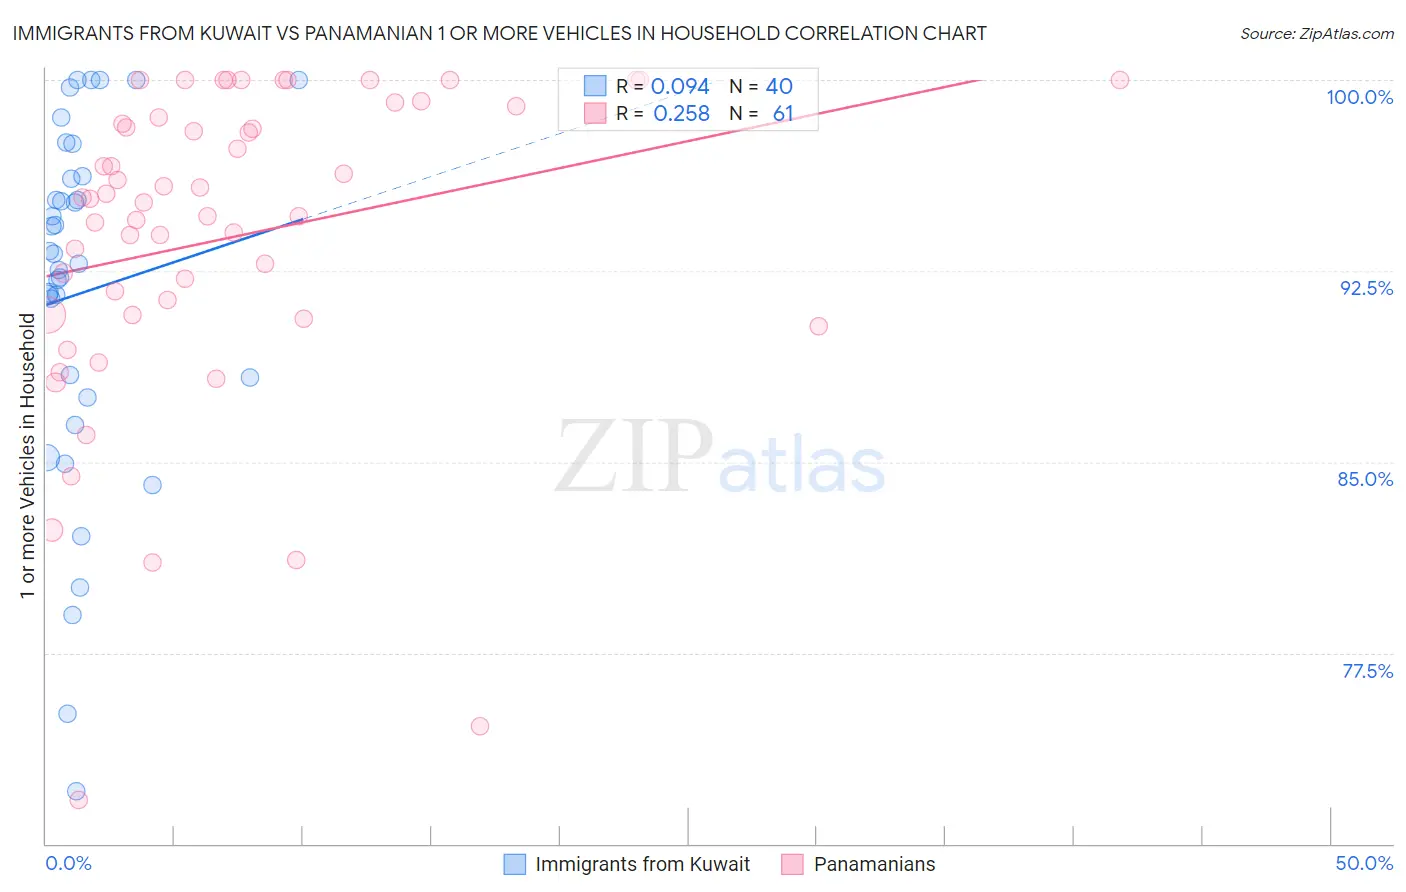
Immigrants from Kuwait vs Panamanian 1 or more Vehicles in Household Correlation Chart
The statistical analysis conducted on geographies consisting of 136,852,839 people shows a slight positive correlation between the proportion of Immigrants from Kuwait and percentage of households with 1 or more vehicles available in the United States with a correlation coefficient (R) of 0.094 and weighted average of 90.7%. Similarly, the statistical analysis conducted on geographies consisting of 281,086,843 people shows a weak positive correlation between the proportion of Panamanians and percentage of households with 1 or more vehicles available in the United States with a correlation coefficient (R) of 0.258 and weighted average of 87.5%, a difference of 3.6%.
1 or more Vehicles in Household Correlation Summary
| Measurement | Immigrants from Kuwait | Panamanian |
| Minimum | 72.1% | 71.7% |
| Maximum | 100.0% | 100.0% |
| Range | 27.9% | 28.3% |
| Mean | 91.6% | 93.8% |
| Median | 93.0% | 95.3% |
| Interquartile 25% (IQ1) | 87.9% | 90.8% |
| Interquartile 75% (IQ3) | 96.2% | 98.7% |
| Interquartile Range (IQR) | 8.3% | 8.0% |
| Standard Deviation (Sample) | 7.0% | 6.3% |
| Standard Deviation (Population) | 6.9% | 6.2% |
Similar Demographics by 1 or more Vehicles in Household
Demographics Similar to Immigrants from Kuwait by 1 or more Vehicles in Household
In terms of 1 or more vehicles in household, the demographic groups most similar to Immigrants from Kuwait are Armenian (90.7%, a difference of 0.020%), Serbian (90.7%, a difference of 0.030%), Chippewa (90.7%, a difference of 0.030%), Immigrants from Netherlands (90.8%, a difference of 0.080%), and Navajo (90.8%, a difference of 0.090%).
| Demographics | Rating | Rank | 1 or more Vehicles in Household |
| Zimbabweans | 97.7 /100 | #106 | Exceptional 91.0% |
| Maltese | 97.7 /100 | #107 | Exceptional 91.0% |
| Hispanics or Latinos | 97.6 /100 | #108 | Exceptional 91.0% |
| Delaware | 97.6 /100 | #109 | Exceptional 91.0% |
| Mexican American Indians | 97.4 /100 | #110 | Exceptional 91.0% |
| Navajo | 95.8 /100 | #111 | Exceptional 90.8% |
| Immigrants | Netherlands | 95.7 /100 | #112 | Exceptional 90.8% |
| Immigrants | Kuwait | 94.7 /100 | #113 | Exceptional 90.7% |
| Armenians | 94.5 /100 | #114 | Exceptional 90.7% |
| Serbians | 94.3 /100 | #115 | Exceptional 90.7% |
| Chippewa | 94.3 /100 | #116 | Exceptional 90.7% |
| Greeks | 93.5 /100 | #117 | Exceptional 90.6% |
| Japanese | 93.4 /100 | #118 | Exceptional 90.6% |
| Blackfeet | 92.6 /100 | #119 | Exceptional 90.6% |
| Immigrants | Thailand | 92.3 /100 | #120 | Exceptional 90.6% |
Demographics Similar to Panamanians by 1 or more Vehicles in Household
In terms of 1 or more vehicles in household, the demographic groups most similar to Panamanians are Immigrants from Africa (87.6%, a difference of 0.010%), Bermudan (87.5%, a difference of 0.010%), Immigrants from Europe (87.6%, a difference of 0.060%), Aleut (87.5%, a difference of 0.070%), and Immigrants from Colombia (87.6%, a difference of 0.10%).
| Demographics | Rating | Rank | 1 or more Vehicles in Household |
| Immigrants | Egypt | 0.5 /100 | #263 | Tragic 87.8% |
| Immigrants | Liberia | 0.4 /100 | #264 | Tragic 87.8% |
| Africans | 0.4 /100 | #265 | Tragic 87.8% |
| Israelis | 0.3 /100 | #266 | Tragic 87.7% |
| Immigrants | Colombia | 0.3 /100 | #267 | Tragic 87.6% |
| Immigrants | Europe | 0.2 /100 | #268 | Tragic 87.6% |
| Immigrants | Africa | 0.2 /100 | #269 | Tragic 87.6% |
| Panamanians | 0.2 /100 | #270 | Tragic 87.5% |
| Bermudans | 0.2 /100 | #271 | Tragic 87.5% |
| Aleuts | 0.2 /100 | #272 | Tragic 87.5% |
| Immigrants | Northern Africa | 0.2 /100 | #273 | Tragic 87.4% |
| Immigrants | Morocco | 0.1 /100 | #274 | Tragic 87.4% |
| Immigrants | Singapore | 0.1 /100 | #275 | Tragic 87.2% |
| Immigrants | France | 0.1 /100 | #276 | Tragic 87.1% |
| Alsatians | 0.1 /100 | #277 | Tragic 87.1% |