Immigrants from Kuwait vs Honduran Per Capita Income
COMPARE
Immigrants from Kuwait
Honduran
Per Capita Income
Per Capita Income Comparison
Immigrants from Kuwait
Hondurans
$46,543
PER CAPITA INCOME
96.2/ 100
METRIC RATING
108th/ 347
METRIC RANK
$37,031
PER CAPITA INCOME
0.1/ 100
METRIC RATING
304th/ 347
METRIC RANK
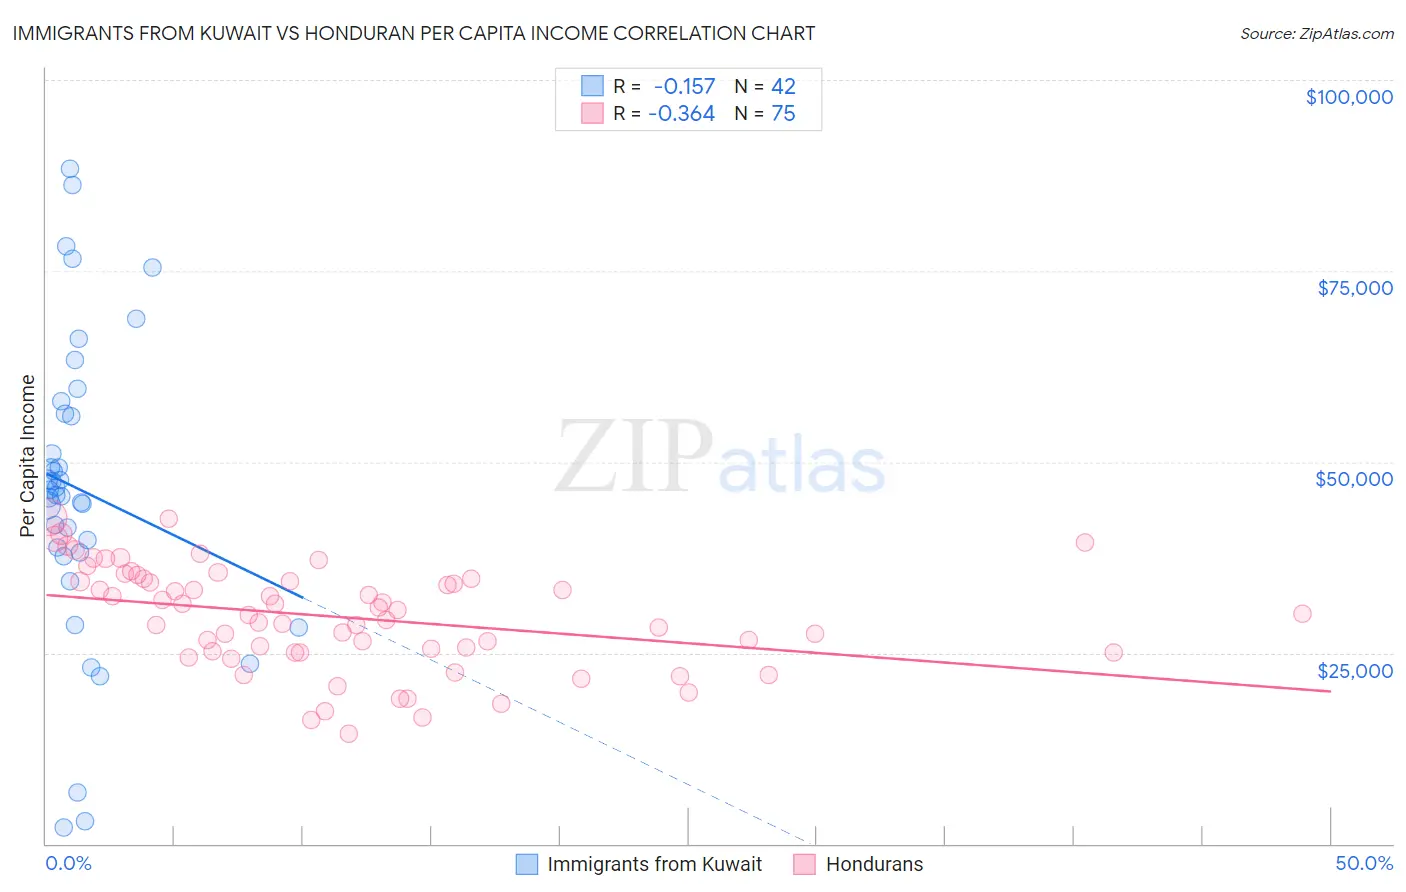
Immigrants from Kuwait vs Honduran Per Capita Income Correlation Chart
The statistical analysis conducted on geographies consisting of 136,913,885 people shows a poor negative correlation between the proportion of Immigrants from Kuwait and per capita income in the United States with a correlation coefficient (R) of -0.157 and weighted average of $46,543. Similarly, the statistical analysis conducted on geographies consisting of 357,835,074 people shows a mild negative correlation between the proportion of Hondurans and per capita income in the United States with a correlation coefficient (R) of -0.364 and weighted average of $37,031, a difference of 25.7%.
Per Capita Income Correlation Summary
| Measurement | Immigrants from Kuwait | Honduran |
| Minimum | $2,068 | $14,358 |
| Maximum | $88,433 | $42,674 |
| Range | $86,365 | $28,316 |
| Mean | $46,335 | $29,671 |
| Median | $46,027 | $30,191 |
| Interquartile 25% (IQ1) | $38,209 | $25,099 |
| Interquartile 75% (IQ3) | $56,277 | $34,632 |
| Interquartile Range (IQR) | $18,068 | $9,533 |
| Standard Deviation (Sample) | $19,760 | $6,736 |
| Standard Deviation (Population) | $19,524 | $6,690 |
Similar Demographics by Per Capita Income
Demographics Similar to Immigrants from Kuwait by Per Capita Income
In terms of per capita income, the demographic groups most similar to Immigrants from Kuwait are Serbian ($46,551, a difference of 0.020%), Immigrants from Northern Africa ($46,531, a difference of 0.030%), British ($46,571, a difference of 0.060%), Ethiopian ($46,569, a difference of 0.060%), and Chilean ($46,459, a difference of 0.18%).
| Demographics | Rating | Rank | Per Capita Income |
| Immigrants | Uzbekistan | 97.5 /100 | #101 | Exceptional $46,929 |
| Immigrants | Western Asia | 97.4 /100 | #102 | Exceptional $46,876 |
| Syrians | 97.2 /100 | #103 | Exceptional $46,837 |
| Brazilians | 96.8 /100 | #104 | Exceptional $46,700 |
| British | 96.3 /100 | #105 | Exceptional $46,571 |
| Ethiopians | 96.3 /100 | #106 | Exceptional $46,569 |
| Serbians | 96.2 /100 | #107 | Exceptional $46,551 |
| Immigrants | Kuwait | 96.2 /100 | #108 | Exceptional $46,543 |
| Immigrants | Northern Africa | 96.2 /100 | #109 | Exceptional $46,531 |
| Chileans | 95.9 /100 | #110 | Exceptional $46,459 |
| Taiwanese | 95.8 /100 | #111 | Exceptional $46,455 |
| Immigrants | Morocco | 95.7 /100 | #112 | Exceptional $46,430 |
| Immigrants | Albania | 95.5 /100 | #113 | Exceptional $46,387 |
| Afghans | 94.9 /100 | #114 | Exceptional $46,268 |
| Immigrants | Chile | 94.6 /100 | #115 | Exceptional $46,213 |
Demographics Similar to Hondurans by Per Capita Income
In terms of per capita income, the demographic groups most similar to Hondurans are Inupiat ($36,999, a difference of 0.080%), Paiute ($37,066, a difference of 0.090%), Shoshone ($37,072, a difference of 0.11%), Ottawa ($37,101, a difference of 0.19%), and Immigrants from Bahamas ($37,193, a difference of 0.44%).
| Demographics | Rating | Rank | Per Capita Income |
| Haitians | 0.1 /100 | #297 | Tragic $37,289 |
| Immigrants | Caribbean | 0.1 /100 | #298 | Tragic $37,254 |
| Cherokee | 0.1 /100 | #299 | Tragic $37,203 |
| Immigrants | Bahamas | 0.1 /100 | #300 | Tragic $37,193 |
| Ottawa | 0.1 /100 | #301 | Tragic $37,101 |
| Shoshone | 0.1 /100 | #302 | Tragic $37,072 |
| Paiute | 0.1 /100 | #303 | Tragic $37,066 |
| Hondurans | 0.1 /100 | #304 | Tragic $37,031 |
| Inupiat | 0.1 /100 | #305 | Tragic $36,999 |
| Immigrants | Haiti | 0.0 /100 | #306 | Tragic $36,849 |
| Immigrants | Latin America | 0.0 /100 | #307 | Tragic $36,823 |
| Fijians | 0.0 /100 | #308 | Tragic $36,690 |
| Immigrants | Honduras | 0.0 /100 | #309 | Tragic $36,665 |
| Ute | 0.0 /100 | #310 | Tragic $36,651 |
| Chippewa | 0.0 /100 | #311 | Tragic $36,631 |