Immigrants from Peru vs Honduran 1 or more Vehicles in Household
COMPARE
Immigrants from Peru
Honduran
1 or more Vehicles in Household
1 or more Vehicles in Household Comparison
Immigrants from Peru
Hondurans
88.6%
1 OR MORE VEHICLES IN HOUSEHOLD
4.7/ 100
METRIC RATING
234th/ 347
METRIC RANK
88.1%
1 OR MORE VEHICLES IN HOUSEHOLD
1.0/ 100
METRIC RATING
253rd/ 347
METRIC RANK
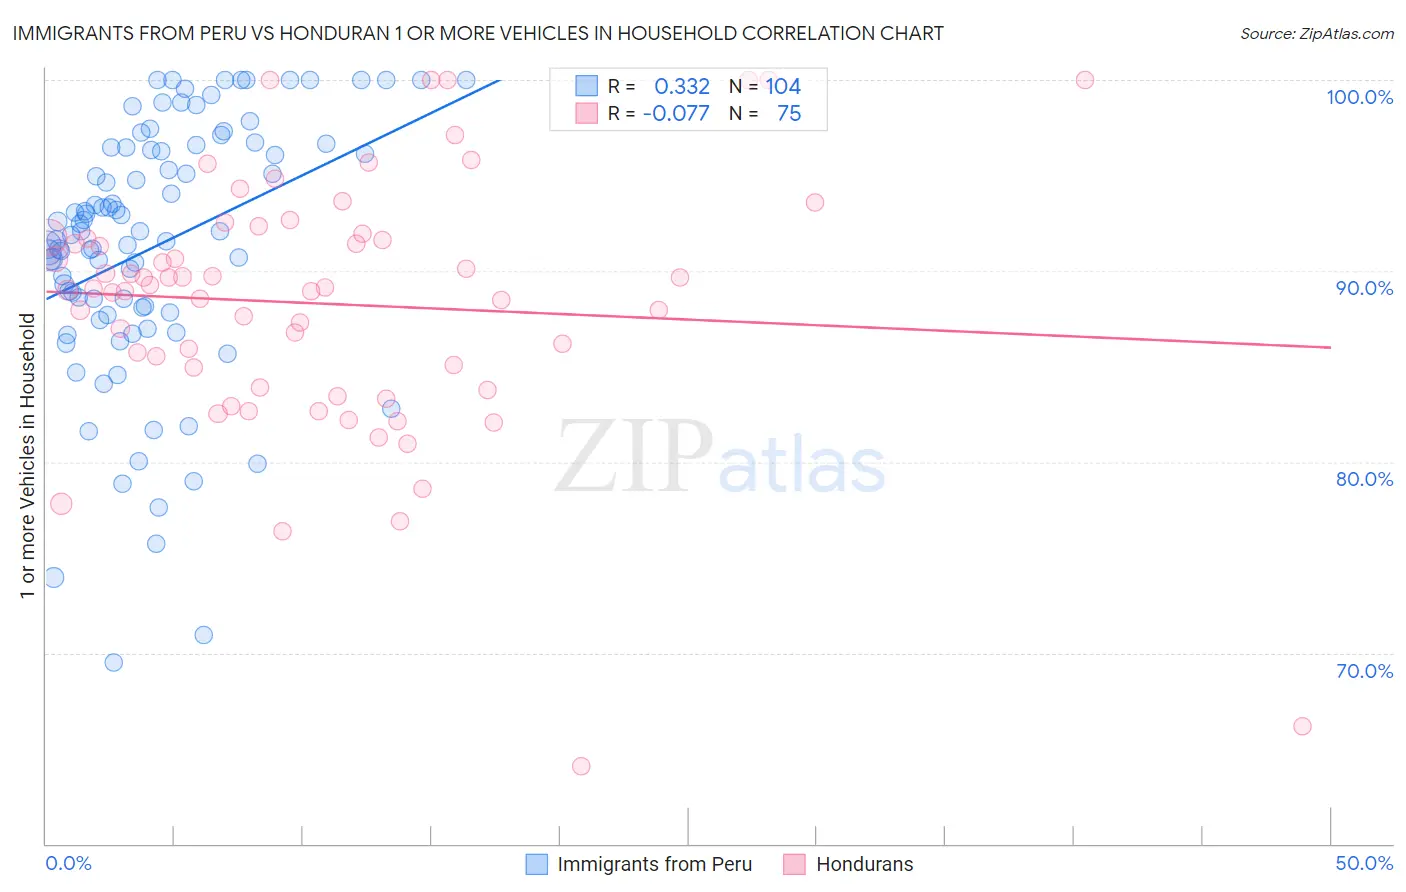
Immigrants from Peru vs Honduran 1 or more Vehicles in Household Correlation Chart
The statistical analysis conducted on geographies consisting of 328,724,512 people shows a mild positive correlation between the proportion of Immigrants from Peru and percentage of households with 1 or more vehicles available in the United States with a correlation coefficient (R) of 0.332 and weighted average of 88.6%. Similarly, the statistical analysis conducted on geographies consisting of 357,633,161 people shows a slight negative correlation between the proportion of Hondurans and percentage of households with 1 or more vehicles available in the United States with a correlation coefficient (R) of -0.077 and weighted average of 88.1%, a difference of 0.64%.
1 or more Vehicles in Household Correlation Summary
| Measurement | Immigrants from Peru | Honduran |
| Minimum | 69.5% | 64.1% |
| Maximum | 100.0% | 100.0% |
| Range | 30.5% | 35.9% |
| Mean | 91.3% | 88.3% |
| Median | 92.1% | 89.1% |
| Interquartile 25% (IQ1) | 88.0% | 83.9% |
| Interquartile 75% (IQ3) | 96.5% | 91.7% |
| Interquartile Range (IQR) | 8.5% | 7.8% |
| Standard Deviation (Sample) | 6.7% | 6.8% |
| Standard Deviation (Population) | 6.7% | 6.7% |
Demographics Similar to Immigrants from Peru and Hondurans by 1 or more Vehicles in Household
In terms of 1 or more vehicles in household, the demographic groups most similar to Immigrants from Peru are Paiute (88.6%, a difference of 0.0%), Houma (88.6%, a difference of 0.010%), Immigrants from Pakistan (88.6%, a difference of 0.020%), Immigrants from Turkey (88.6%, a difference of 0.030%), and Immigrants from Somalia (88.6%, a difference of 0.050%). Similarly, the demographic groups most similar to Hondurans are Immigrants from Uruguay (88.1%, a difference of 0.030%), Immigrants from Serbia (88.2%, a difference of 0.090%), Egyptian (88.2%, a difference of 0.10%), Black/African American (88.2%, a difference of 0.14%), and Immigrants from Nigeria (88.2%, a difference of 0.19%).
| Demographics | Rating | Rank | 1 or more Vehicles in Household |
| Houma | 4.8 /100 | #233 | Tragic 88.6% |
| Immigrants | Peru | 4.7 /100 | #234 | Tragic 88.6% |
| Paiute | 4.6 /100 | #235 | Tragic 88.6% |
| Immigrants | Pakistan | 4.5 /100 | #236 | Tragic 88.6% |
| Immigrants | Turkey | 4.4 /100 | #237 | Tragic 88.6% |
| Immigrants | Somalia | 4.2 /100 | #238 | Tragic 88.6% |
| Kiowa | 3.8 /100 | #239 | Tragic 88.6% |
| Eastern Europeans | 3.0 /100 | #240 | Tragic 88.5% |
| Taiwanese | 2.6 /100 | #241 | Tragic 88.4% |
| Turks | 2.5 /100 | #242 | Tragic 88.4% |
| Immigrants | Belgium | 2.1 /100 | #243 | Tragic 88.4% |
| Immigrants | Portugal | 2.0 /100 | #244 | Tragic 88.3% |
| Immigrants | Czechoslovakia | 1.9 /100 | #245 | Tragic 88.3% |
| Menominee | 1.9 /100 | #246 | Tragic 88.3% |
| Immigrants | Honduras | 1.7 /100 | #247 | Tragic 88.3% |
| Immigrants | Nigeria | 1.5 /100 | #248 | Tragic 88.2% |
| Blacks/African Americans | 1.4 /100 | #249 | Tragic 88.2% |
| Egyptians | 1.2 /100 | #250 | Tragic 88.2% |
| Immigrants | Serbia | 1.2 /100 | #251 | Tragic 88.2% |
| Immigrants | Uruguay | 1.1 /100 | #252 | Tragic 88.1% |
| Hondurans | 1.0 /100 | #253 | Tragic 88.1% |