Immigrants from Colombia vs Indian (Asian) 1 or more Vehicles in Household
COMPARE
Immigrants from Colombia
Indian (Asian)
1 or more Vehicles in Household
1 or more Vehicles in Household Comparison
Immigrants from Colombia
Indians (Asian)
87.6%
1 OR MORE VEHICLES IN HOUSEHOLD
0.3/ 100
METRIC RATING
267th/ 347
METRIC RANK
86.0%
1 OR MORE VEHICLES IN HOUSEHOLD
0.0/ 100
METRIC RATING
293rd/ 347
METRIC RANK
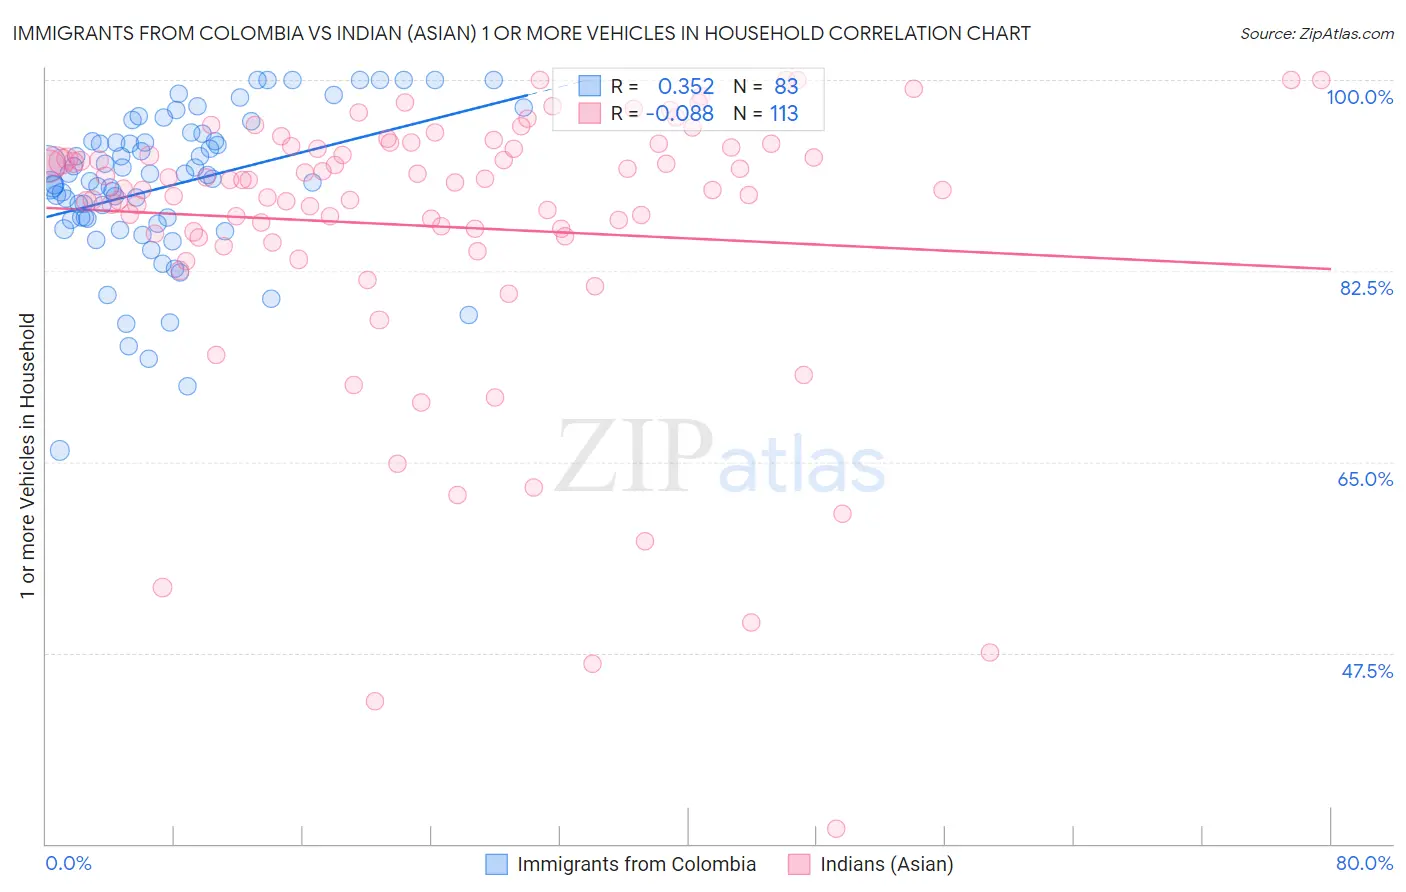
Immigrants from Colombia vs Indian (Asian) 1 or more Vehicles in Household Correlation Chart
The statistical analysis conducted on geographies consisting of 378,512,544 people shows a mild positive correlation between the proportion of Immigrants from Colombia and percentage of households with 1 or more vehicles available in the United States with a correlation coefficient (R) of 0.352 and weighted average of 87.6%. Similarly, the statistical analysis conducted on geographies consisting of 494,856,694 people shows a slight negative correlation between the proportion of Indians (Asian) and percentage of households with 1 or more vehicles available in the United States with a correlation coefficient (R) of -0.088 and weighted average of 86.0%, a difference of 1.8%.
1 or more Vehicles in Household Correlation Summary
| Measurement | Immigrants from Colombia | Indian (Asian) |
| Minimum | 66.1% | 31.4% |
| Maximum | 100.0% | 100.0% |
| Range | 33.9% | 68.6% |
| Mean | 90.3% | 86.6% |
| Median | 90.9% | 90.6% |
| Interquartile 25% (IQ1) | 87.2% | 85.8% |
| Interquartile 75% (IQ3) | 94.4% | 93.9% |
| Interquartile Range (IQR) | 7.2% | 8.1% |
| Standard Deviation (Sample) | 6.9% | 13.0% |
| Standard Deviation (Population) | 6.9% | 13.0% |
Similar Demographics by 1 or more Vehicles in Household
Demographics Similar to Immigrants from Colombia by 1 or more Vehicles in Household
In terms of 1 or more vehicles in household, the demographic groups most similar to Immigrants from Colombia are Israeli (87.7%, a difference of 0.030%), Immigrants from Europe (87.6%, a difference of 0.030%), Immigrants from Africa (87.6%, a difference of 0.080%), Panamanian (87.5%, a difference of 0.10%), and Bermudan (87.5%, a difference of 0.10%).
| Demographics | Rating | Rank | 1 or more Vehicles in Household |
| Macedonians | 0.6 /100 | #260 | Tragic 87.9% |
| Immigrants | Switzerland | 0.6 /100 | #261 | Tragic 87.9% |
| Sub-Saharan Africans | 0.5 /100 | #262 | Tragic 87.9% |
| Immigrants | Egypt | 0.5 /100 | #263 | Tragic 87.8% |
| Immigrants | Liberia | 0.4 /100 | #264 | Tragic 87.8% |
| Africans | 0.4 /100 | #265 | Tragic 87.8% |
| Israelis | 0.3 /100 | #266 | Tragic 87.7% |
| Immigrants | Colombia | 0.3 /100 | #267 | Tragic 87.6% |
| Immigrants | Europe | 0.2 /100 | #268 | Tragic 87.6% |
| Immigrants | Africa | 0.2 /100 | #269 | Tragic 87.6% |
| Panamanians | 0.2 /100 | #270 | Tragic 87.5% |
| Bermudans | 0.2 /100 | #271 | Tragic 87.5% |
| Aleuts | 0.2 /100 | #272 | Tragic 87.5% |
| Immigrants | Northern Africa | 0.2 /100 | #273 | Tragic 87.4% |
| Immigrants | Morocco | 0.1 /100 | #274 | Tragic 87.4% |
Demographics Similar to Indians (Asian) by 1 or more Vehicles in Household
In terms of 1 or more vehicles in household, the demographic groups most similar to Indians (Asian) are Okinawan (86.1%, a difference of 0.060%), Alaskan Athabascan (86.0%, a difference of 0.070%), Immigrants from Jamaica (85.8%, a difference of 0.24%), Immigrants from Spain (85.8%, a difference of 0.28%), and Pima (86.3%, a difference of 0.29%).
| Demographics | Rating | Rank | 1 or more Vehicles in Household |
| Immigrants | Eastern Asia | 0.0 /100 | #286 | Tragic 86.5% |
| Immigrants | Malaysia | 0.0 /100 | #287 | Tragic 86.5% |
| Hopi | 0.0 /100 | #288 | Tragic 86.4% |
| Immigrants | Ireland | 0.0 /100 | #289 | Tragic 86.4% |
| Immigrants | Australia | 0.0 /100 | #290 | Tragic 86.4% |
| Pima | 0.0 /100 | #291 | Tragic 86.3% |
| Okinawans | 0.0 /100 | #292 | Tragic 86.1% |
| Indians (Asian) | 0.0 /100 | #293 | Tragic 86.0% |
| Alaskan Athabascans | 0.0 /100 | #294 | Tragic 86.0% |
| Immigrants | Jamaica | 0.0 /100 | #295 | Tragic 85.8% |
| Immigrants | Spain | 0.0 /100 | #296 | Tragic 85.8% |
| Paraguayans | 0.0 /100 | #297 | Tragic 85.7% |
| Belizeans | 0.0 /100 | #298 | Tragic 85.7% |
| Yuman | 0.0 /100 | #299 | Tragic 85.5% |
| Immigrants | Russia | 0.0 /100 | #300 | Tragic 85.4% |