Immigrants from Uganda vs Afghan 2 or more Vehicles in Household
COMPARE
Immigrants from Uganda
Afghan
2 or more Vehicles in Household
2 or more Vehicles in Household Comparison
Immigrants from Uganda
Afghans
55.0%
2 OR MORE VEHICLES IN HOUSEHOLD
33.4/ 100
METRIC RATING
187th/ 347
METRIC RANK
59.0%
2 OR MORE VEHICLES IN HOUSEHOLD
99.9/ 100
METRIC RATING
57th/ 347
METRIC RANK
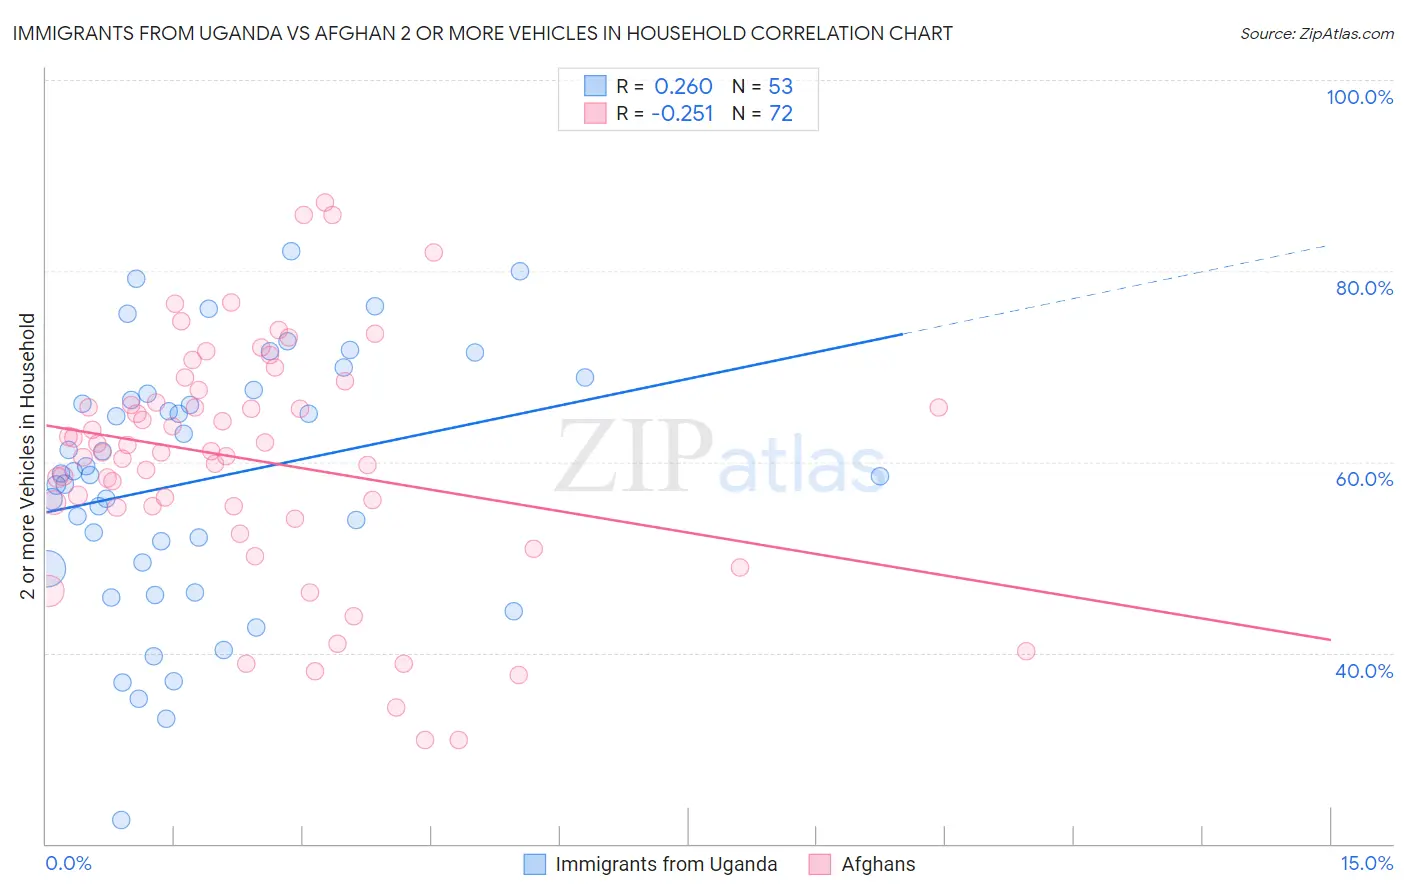
Immigrants from Uganda vs Afghan 2 or more Vehicles in Household Correlation Chart
The statistical analysis conducted on geographies consisting of 125,974,533 people shows a weak positive correlation between the proportion of Immigrants from Uganda and percentage of households with 2 or more vehicles available in the United States with a correlation coefficient (R) of 0.260 and weighted average of 55.0%. Similarly, the statistical analysis conducted on geographies consisting of 148,831,306 people shows a weak negative correlation between the proportion of Afghans and percentage of households with 2 or more vehicles available in the United States with a correlation coefficient (R) of -0.251 and weighted average of 59.0%, a difference of 7.3%.
2 or more Vehicles in Household Correlation Summary
| Measurement | Immigrants from Uganda | Afghan |
| Minimum | 22.5% | 30.8% |
| Maximum | 82.0% | 87.1% |
| Range | 59.5% | 56.3% |
| Mean | 58.2% | 60.2% |
| Median | 58.8% | 61.1% |
| Interquartile 25% (IQ1) | 49.1% | 55.3% |
| Interquartile 75% (IQ3) | 67.3% | 66.8% |
| Interquartile Range (IQR) | 18.2% | 11.5% |
| Standard Deviation (Sample) | 13.3% | 12.6% |
| Standard Deviation (Population) | 13.2% | 12.5% |
Similar Demographics by 2 or more Vehicles in Household
Demographics Similar to Immigrants from Uganda by 2 or more Vehicles in Household
In terms of 2 or more vehicles in household, the demographic groups most similar to Immigrants from Uganda are Peruvian (55.0%, a difference of 0.010%), Arab (55.0%, a difference of 0.11%), Marshallese (54.9%, a difference of 0.13%), Apache (55.1%, a difference of 0.15%), and Immigrants from Cameroon (55.1%, a difference of 0.17%).
| Demographics | Rating | Rank | 2 or more Vehicles in Household |
| Immigrants | Kenya | 40.4 /100 | #180 | Average 55.1% |
| Immigrants | Micronesia | 38.2 /100 | #181 | Fair 55.1% |
| Cree | 38.2 /100 | #182 | Fair 55.1% |
| Immigrants | Cameroon | 37.3 /100 | #183 | Fair 55.1% |
| Apache | 36.7 /100 | #184 | Fair 55.1% |
| Arabs | 35.9 /100 | #185 | Fair 55.0% |
| Peruvians | 33.7 /100 | #186 | Fair 55.0% |
| Immigrants | Uganda | 33.4 /100 | #187 | Fair 55.0% |
| Marshallese | 30.5 /100 | #188 | Fair 54.9% |
| Eastern Europeans | 27.5 /100 | #189 | Fair 54.8% |
| Russians | 26.3 /100 | #190 | Fair 54.8% |
| Immigrants | Immigrants | 25.0 /100 | #191 | Fair 54.7% |
| Immigrants | Romania | 23.8 /100 | #192 | Fair 54.7% |
| Immigrants | Japan | 23.4 /100 | #193 | Fair 54.7% |
| Central Americans | 23.0 /100 | #194 | Fair 54.7% |
Demographics Similar to Afghans by 2 or more Vehicles in Household
In terms of 2 or more vehicles in household, the demographic groups most similar to Afghans are Chickasaw (59.0%, a difference of 0.0%), Luxembourger (59.1%, a difference of 0.11%), Bhutanese (59.1%, a difference of 0.14%), Immigrants from Scotland (58.9%, a difference of 0.18%), and Spanish American (58.9%, a difference of 0.21%).
| Demographics | Rating | Rank | 2 or more Vehicles in Household |
| Choctaw | 99.9 /100 | #50 | Exceptional 59.3% |
| Spaniards | 99.9 /100 | #51 | Exceptional 59.2% |
| Immigrants | Laos | 99.9 /100 | #52 | Exceptional 59.2% |
| Celtics | 99.9 /100 | #53 | Exceptional 59.2% |
| Bhutanese | 99.9 /100 | #54 | Exceptional 59.1% |
| Luxembourgers | 99.9 /100 | #55 | Exceptional 59.1% |
| Chickasaw | 99.9 /100 | #56 | Exceptional 59.0% |
| Afghans | 99.9 /100 | #57 | Exceptional 59.0% |
| Immigrants | Scotland | 99.8 /100 | #58 | Exceptional 58.9% |
| Spanish Americans | 99.8 /100 | #59 | Exceptional 58.9% |
| French Canadians | 99.8 /100 | #60 | Exceptional 58.9% |
| Osage | 99.8 /100 | #61 | Exceptional 58.8% |
| Immigrants | Nonimmigrants | 99.8 /100 | #62 | Exceptional 58.8% |
| Mexican American Indians | 99.8 /100 | #63 | Exceptional 58.7% |
| Portuguese | 99.7 /100 | #64 | Exceptional 58.6% |