Immigrants from Oceania vs Navajo 1 or more Vehicles in Household
COMPARE
Immigrants from Oceania
Navajo
1 or more Vehicles in Household
1 or more Vehicles in Household Comparison
Immigrants from Oceania
Navajo
90.4%
1 OR MORE VEHICLES IN HOUSEHOLD
86.9/ 100
METRIC RATING
135th/ 347
METRIC RANK
90.8%
1 OR MORE VEHICLES IN HOUSEHOLD
95.8/ 100
METRIC RATING
111th/ 347
METRIC RANK
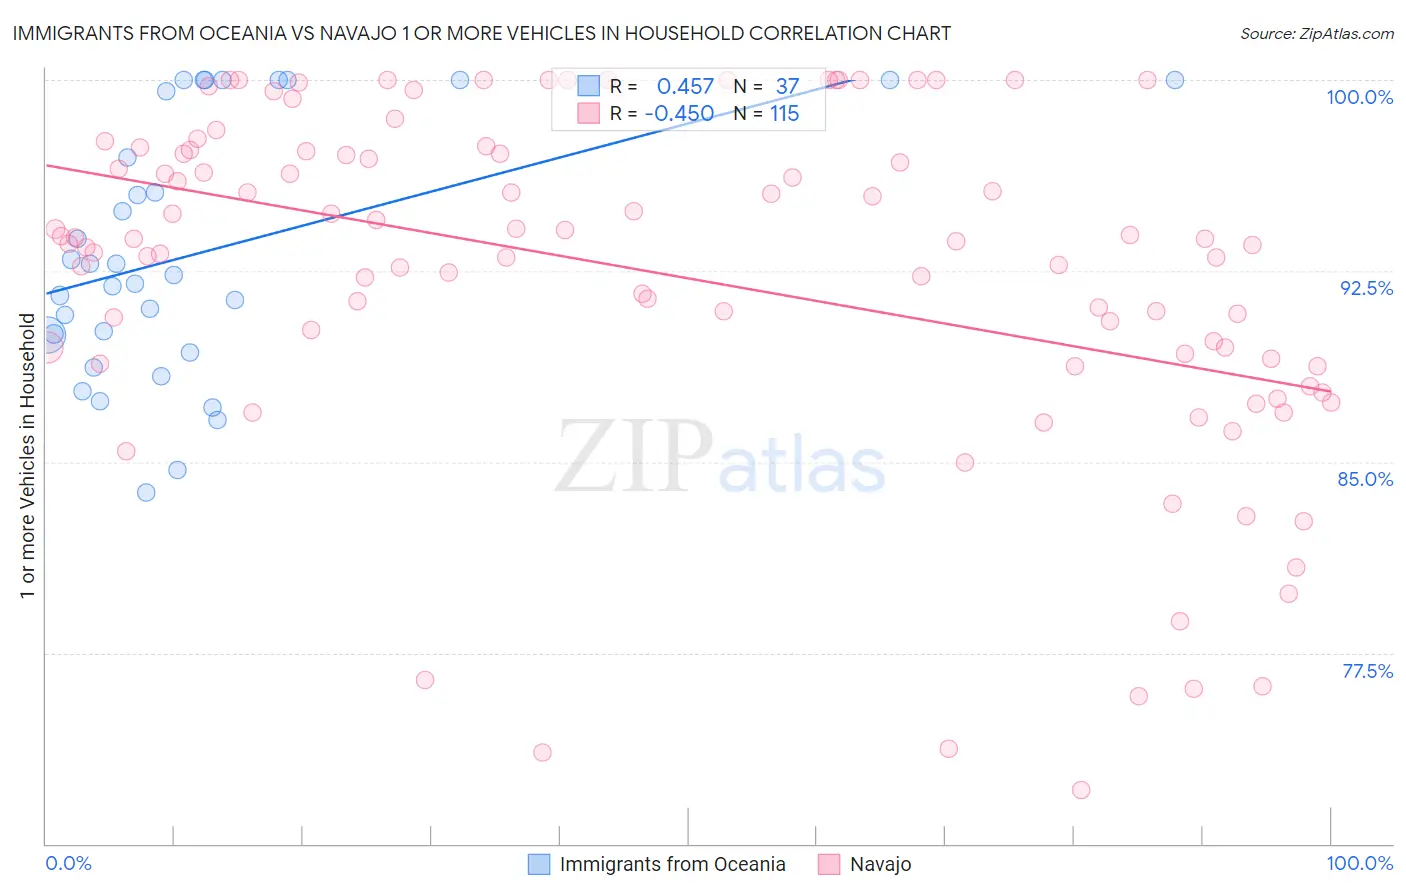
Immigrants from Oceania vs Navajo 1 or more Vehicles in Household Correlation Chart
The statistical analysis conducted on geographies consisting of 305,395,029 people shows a moderate positive correlation between the proportion of Immigrants from Oceania and percentage of households with 1 or more vehicles available in the United States with a correlation coefficient (R) of 0.457 and weighted average of 90.4%. Similarly, the statistical analysis conducted on geographies consisting of 224,767,823 people shows a moderate negative correlation between the proportion of Navajo and percentage of households with 1 or more vehicles available in the United States with a correlation coefficient (R) of -0.450 and weighted average of 90.8%, a difference of 0.47%.
1 or more Vehicles in Household Correlation Summary
| Measurement | Immigrants from Oceania | Navajo |
| Minimum | 83.8% | 72.1% |
| Maximum | 100.0% | 100.0% |
| Range | 16.2% | 27.9% |
| Mean | 93.2% | 92.4% |
| Median | 92.4% | 93.7% |
| Interquartile 25% (IQ1) | 89.6% | 89.1% |
| Interquartile 75% (IQ3) | 99.8% | 97.2% |
| Interquartile Range (IQR) | 10.2% | 8.2% |
| Standard Deviation (Sample) | 5.0% | 6.7% |
| Standard Deviation (Population) | 4.9% | 6.7% |
Similar Demographics by 1 or more Vehicles in Household
Demographics Similar to Immigrants from Oceania by 1 or more Vehicles in Household
In terms of 1 or more vehicles in household, the demographic groups most similar to Immigrants from Oceania are Kenyan (90.4%, a difference of 0.0%), Immigrants from Syria (90.4%, a difference of 0.020%), Hungarian (90.3%, a difference of 0.020%), Latvian (90.3%, a difference of 0.020%), and Syrian (90.3%, a difference of 0.020%).
| Demographics | Rating | Rank | 1 or more Vehicles in Household |
| Burmese | 89.0 /100 | #128 | Excellent 90.4% |
| Marshallese | 88.9 /100 | #129 | Excellent 90.4% |
| Nicaraguans | 88.8 /100 | #130 | Excellent 90.4% |
| Immigrants | Kenya | 88.5 /100 | #131 | Excellent 90.4% |
| Immigrants | South Africa | 88.1 /100 | #132 | Excellent 90.4% |
| Immigrants | Syria | 87.5 /100 | #133 | Excellent 90.4% |
| Kenyans | 87.0 /100 | #134 | Excellent 90.4% |
| Immigrants | Oceania | 86.9 /100 | #135 | Excellent 90.4% |
| Hungarians | 86.5 /100 | #136 | Excellent 90.3% |
| Latvians | 86.3 /100 | #137 | Excellent 90.3% |
| Syrians | 86.3 /100 | #138 | Excellent 90.3% |
| Estonians | 85.6 /100 | #139 | Excellent 90.3% |
| Sudanese | 85.2 /100 | #140 | Excellent 90.3% |
| Immigrants | Moldova | 83.1 /100 | #141 | Excellent 90.2% |
| Immigrants | Lithuania | 83.0 /100 | #142 | Excellent 90.2% |
Demographics Similar to Navajo by 1 or more Vehicles in Household
In terms of 1 or more vehicles in household, the demographic groups most similar to Navajo are Immigrants from Netherlands (90.8%, a difference of 0.010%), Immigrants from Kuwait (90.7%, a difference of 0.090%), Armenian (90.7%, a difference of 0.11%), Serbian (90.7%, a difference of 0.12%), and Chippewa (90.7%, a difference of 0.13%).
| Demographics | Rating | Rank | 1 or more Vehicles in Household |
| Asians | 98.2 /100 | #104 | Exceptional 91.1% |
| Laotians | 98.0 /100 | #105 | Exceptional 91.0% |
| Zimbabweans | 97.7 /100 | #106 | Exceptional 91.0% |
| Maltese | 97.7 /100 | #107 | Exceptional 91.0% |
| Hispanics or Latinos | 97.6 /100 | #108 | Exceptional 91.0% |
| Delaware | 97.6 /100 | #109 | Exceptional 91.0% |
| Mexican American Indians | 97.4 /100 | #110 | Exceptional 91.0% |
| Navajo | 95.8 /100 | #111 | Exceptional 90.8% |
| Immigrants | Netherlands | 95.7 /100 | #112 | Exceptional 90.8% |
| Immigrants | Kuwait | 94.7 /100 | #113 | Exceptional 90.7% |
| Armenians | 94.5 /100 | #114 | Exceptional 90.7% |
| Serbians | 94.3 /100 | #115 | Exceptional 90.7% |
| Chippewa | 94.3 /100 | #116 | Exceptional 90.7% |
| Greeks | 93.5 /100 | #117 | Exceptional 90.6% |
| Japanese | 93.4 /100 | #118 | Exceptional 90.6% |