Immigrants from Jordan vs Chippewa Per Capita Income
COMPARE
Immigrants from Jordan
Chippewa
Per Capita Income
Per Capita Income Comparison
Immigrants from Jordan
Chippewa
$45,066
PER CAPITA INCOME
82.9/ 100
METRIC RATING
140th/ 347
METRIC RANK
$36,631
PER CAPITA INCOME
0.0/ 100
METRIC RATING
311th/ 347
METRIC RANK
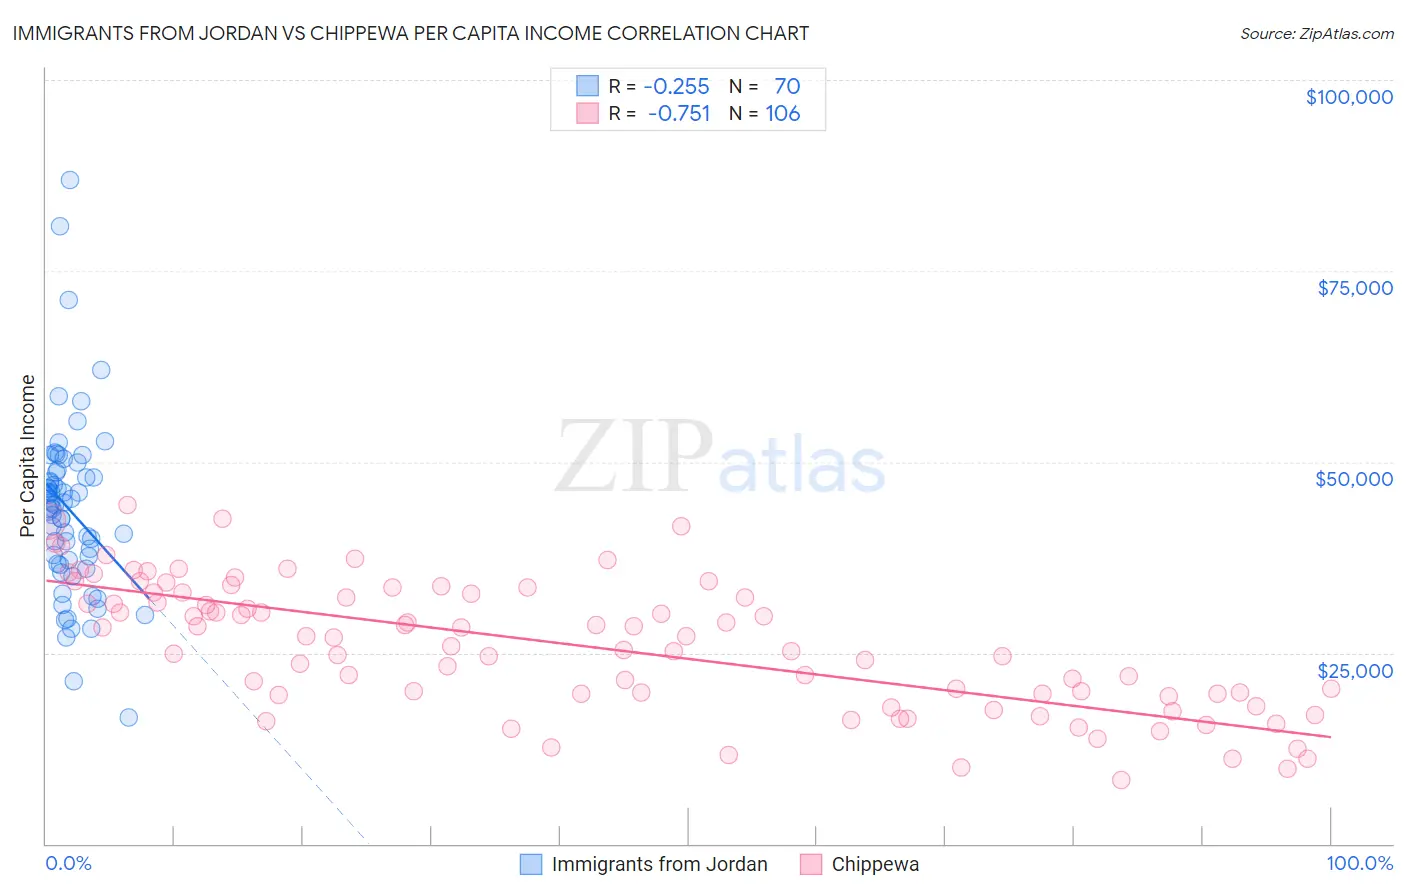
Immigrants from Jordan vs Chippewa Per Capita Income Correlation Chart
The statistical analysis conducted on geographies consisting of 181,275,408 people shows a weak negative correlation between the proportion of Immigrants from Jordan and per capita income in the United States with a correlation coefficient (R) of -0.255 and weighted average of $45,066. Similarly, the statistical analysis conducted on geographies consisting of 215,067,961 people shows a strong negative correlation between the proportion of Chippewa and per capita income in the United States with a correlation coefficient (R) of -0.751 and weighted average of $36,631, a difference of 23.0%.
Per Capita Income Correlation Summary
| Measurement | Immigrants from Jordan | Chippewa |
| Minimum | $16,508 | $8,325 |
| Maximum | $86,887 | $44,407 |
| Range | $70,379 | $36,082 |
| Mean | $43,703 | $25,989 |
| Median | $44,361 | $27,024 |
| Interquartile 25% (IQ1) | $36,695 | $19,564 |
| Interquartile 75% (IQ3) | $48,682 | $32,911 |
| Interquartile Range (IQR) | $11,987 | $13,347 |
| Standard Deviation (Sample) | $11,687 | $8,516 |
| Standard Deviation (Population) | $11,603 | $8,476 |
Similar Demographics by Per Capita Income
Demographics Similar to Immigrants from Jordan by Per Capita Income
In terms of per capita income, the demographic groups most similar to Immigrants from Jordan are Slavic ($45,049, a difference of 0.040%), Ugandan ($45,047, a difference of 0.040%), Basque ($45,086, a difference of 0.050%), Immigrants from Uganda ($45,043, a difference of 0.050%), and Icelander ($44,987, a difference of 0.18%).
| Demographics | Rating | Rank | Per Capita Income |
| Pakistanis | 89.7 /100 | #133 | Excellent $45,587 |
| Slovenes | 89.6 /100 | #134 | Excellent $45,581 |
| Hungarians | 87.9 /100 | #135 | Excellent $45,426 |
| Immigrants | Oceania | 85.2 /100 | #136 | Excellent $45,220 |
| Immigrants | Syria | 85.2 /100 | #137 | Excellent $45,218 |
| Assyrians/Chaldeans/Syriacs | 84.8 /100 | #138 | Excellent $45,195 |
| Basques | 83.2 /100 | #139 | Excellent $45,086 |
| Immigrants | Jordan | 82.9 /100 | #140 | Excellent $45,066 |
| Slavs | 82.6 /100 | #141 | Excellent $45,049 |
| Ugandans | 82.6 /100 | #142 | Excellent $45,047 |
| Immigrants | Uganda | 82.5 /100 | #143 | Excellent $45,043 |
| Icelanders | 81.6 /100 | #144 | Excellent $44,987 |
| Immigrants | Afghanistan | 78.0 /100 | #145 | Good $44,790 |
| Irish | 75.8 /100 | #146 | Good $44,679 |
| Czechs | 74.1 /100 | #147 | Good $44,595 |
Demographics Similar to Chippewa by Per Capita Income
In terms of per capita income, the demographic groups most similar to Chippewa are Ute ($36,651, a difference of 0.060%), Immigrants from Honduras ($36,665, a difference of 0.090%), Fijian ($36,690, a difference of 0.16%), Chickasaw ($36,475, a difference of 0.43%), and Immigrants from Latin America ($36,823, a difference of 0.53%).
| Demographics | Rating | Rank | Per Capita Income |
| Hondurans | 0.1 /100 | #304 | Tragic $37,031 |
| Inupiat | 0.1 /100 | #305 | Tragic $36,999 |
| Immigrants | Haiti | 0.0 /100 | #306 | Tragic $36,849 |
| Immigrants | Latin America | 0.0 /100 | #307 | Tragic $36,823 |
| Fijians | 0.0 /100 | #308 | Tragic $36,690 |
| Immigrants | Honduras | 0.0 /100 | #309 | Tragic $36,665 |
| Ute | 0.0 /100 | #310 | Tragic $36,651 |
| Chippewa | 0.0 /100 | #311 | Tragic $36,631 |
| Chickasaw | 0.0 /100 | #312 | Tragic $36,475 |
| Bahamians | 0.0 /100 | #313 | Tragic $36,427 |
| Seminole | 0.0 /100 | #314 | Tragic $36,180 |
| Yaqui | 0.0 /100 | #315 | Tragic $36,112 |
| Choctaw | 0.0 /100 | #316 | Tragic $35,999 |
| Dutch West Indians | 0.0 /100 | #317 | Tragic $35,922 |
| Bangladeshis | 0.0 /100 | #318 | Tragic $35,897 |