Immigrants from Jamaica vs Immigrants from North Macedonia Receiving Food Stamps
COMPARE
Immigrants from Jamaica
Immigrants from North Macedonia
Receiving Food Stamps
Receiving Food Stamps Comparison
Immigrants from Jamaica
Immigrants from North Macedonia
16.9%
RECEIVING FOOD STAMPS
0.0/ 100
METRIC RATING
313th/ 347
METRIC RANK
10.0%
RECEIVING FOOD STAMPS
98.7/ 100
METRIC RATING
77th/ 347
METRIC RANK
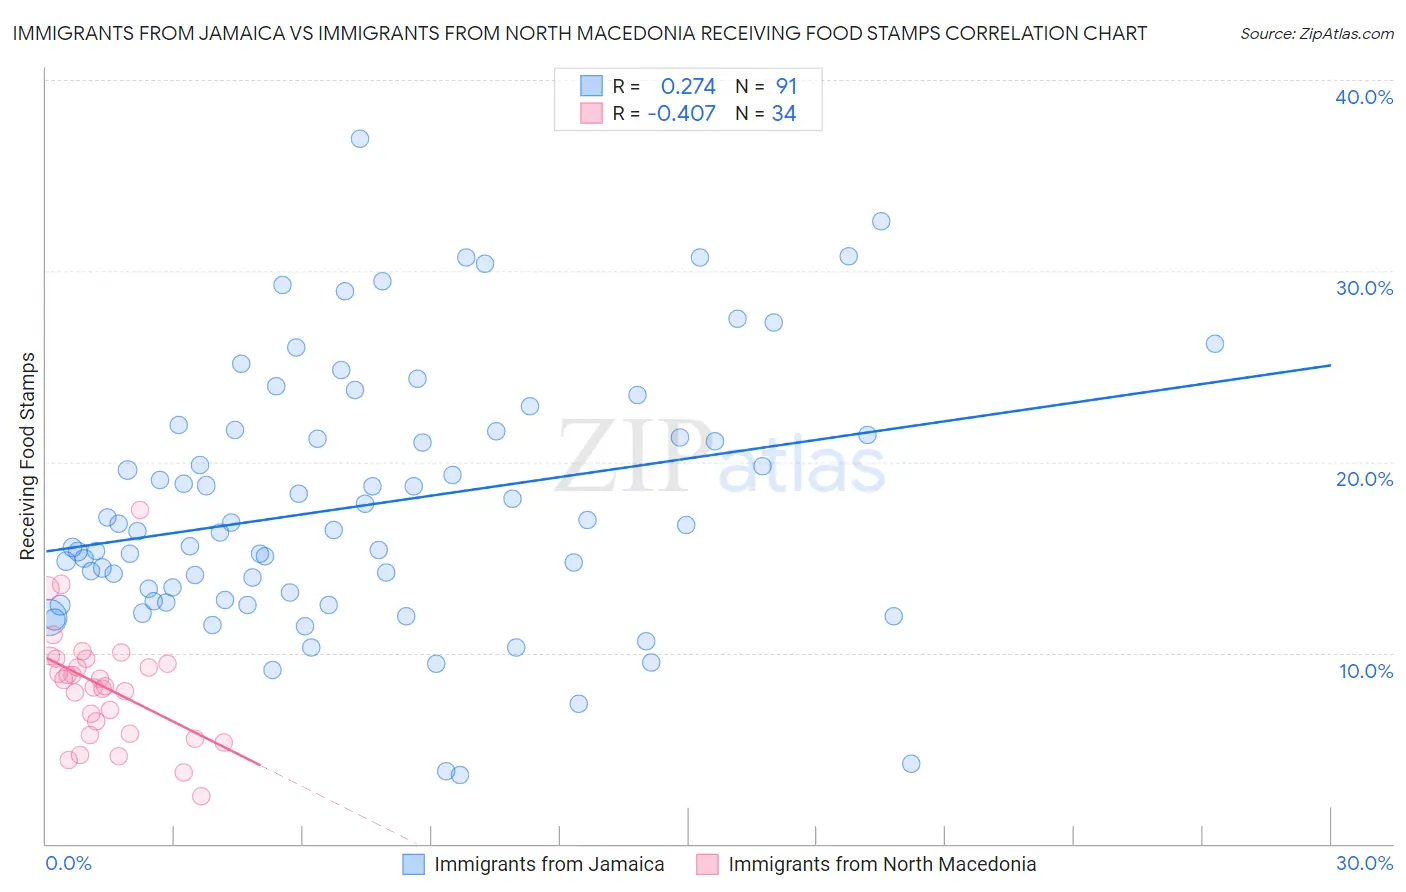
Immigrants from Jamaica vs Immigrants from North Macedonia Receiving Food Stamps Correlation Chart
The statistical analysis conducted on geographies consisting of 301,234,933 people shows a weak positive correlation between the proportion of Immigrants from Jamaica and percentage of population receiving government assistance and/or food stamps in the United States with a correlation coefficient (R) of 0.274 and weighted average of 16.9%. Similarly, the statistical analysis conducted on geographies consisting of 74,225,836 people shows a moderate negative correlation between the proportion of Immigrants from North Macedonia and percentage of population receiving government assistance and/or food stamps in the United States with a correlation coefficient (R) of -0.407 and weighted average of 10.0%, a difference of 69.5%.
Receiving Food Stamps Correlation Summary
| Measurement | Immigrants from Jamaica | Immigrants from North Macedonia |
| Minimum | 3.6% | 2.5% |
| Maximum | 36.9% | 17.5% |
| Range | 33.3% | 15.0% |
| Mean | 17.7% | 8.2% |
| Median | 16.4% | 8.4% |
| Interquartile 25% (IQ1) | 12.8% | 5.8% |
| Interquartile 75% (IQ3) | 21.6% | 9.7% |
| Interquartile Range (IQR) | 8.8% | 3.9% |
| Standard Deviation (Sample) | 6.7% | 3.0% |
| Standard Deviation (Population) | 6.7% | 3.0% |
Similar Demographics by Receiving Food Stamps
Demographics Similar to Immigrants from Jamaica by Receiving Food Stamps
In terms of receiving food stamps, the demographic groups most similar to Immigrants from Jamaica are Immigrants from Guyana (16.9%, a difference of 0.17%), Sioux (16.8%, a difference of 0.28%), Bahamian (17.0%, a difference of 0.74%), Guyanese (16.7%, a difference of 0.98%), and Central American Indian (17.1%, a difference of 1.2%).
| Demographics | Rating | Rank | Receiving Food Stamps |
| Jamaicans | 0.0 /100 | #306 | Tragic 16.4% |
| Houma | 0.0 /100 | #307 | Tragic 16.5% |
| Barbadians | 0.0 /100 | #308 | Tragic 16.5% |
| U.S. Virgin Islanders | 0.0 /100 | #309 | Tragic 16.5% |
| Immigrants | Barbados | 0.0 /100 | #310 | Tragic 16.6% |
| Guyanese | 0.0 /100 | #311 | Tragic 16.7% |
| Sioux | 0.0 /100 | #312 | Tragic 16.8% |
| Immigrants | Jamaica | 0.0 /100 | #313 | Tragic 16.9% |
| Immigrants | Guyana | 0.0 /100 | #314 | Tragic 16.9% |
| Bahamians | 0.0 /100 | #315 | Tragic 17.0% |
| Central American Indians | 0.0 /100 | #316 | Tragic 17.1% |
| Blacks/African Americans | 0.0 /100 | #317 | Tragic 17.2% |
| Menominee | 0.0 /100 | #318 | Tragic 17.2% |
| Immigrants | St. Vincent and the Grenadines | 0.0 /100 | #319 | Tragic 17.2% |
| Immigrants | Nicaragua | 0.0 /100 | #320 | Tragic 17.2% |
Demographics Similar to Immigrants from North Macedonia by Receiving Food Stamps
In terms of receiving food stamps, the demographic groups most similar to Immigrants from North Macedonia are South African (10.0%, a difference of 0.050%), Immigrants from Croatia (10.0%, a difference of 0.080%), Laotian (10.0%, a difference of 0.080%), Immigrants from Zimbabwe (9.9%, a difference of 0.090%), and Polish (10.0%, a difference of 0.16%).
| Demographics | Rating | Rank | Receiving Food Stamps |
| Immigrants | Serbia | 99.0 /100 | #70 | Exceptional 9.9% |
| Scottish | 98.9 /100 | #71 | Exceptional 9.9% |
| Immigrants | Asia | 98.9 /100 | #72 | Exceptional 9.9% |
| Macedonians | 98.9 /100 | #73 | Exceptional 9.9% |
| New Zealanders | 98.8 /100 | #74 | Exceptional 9.9% |
| Immigrants | Zimbabwe | 98.7 /100 | #75 | Exceptional 9.9% |
| Immigrants | Croatia | 98.7 /100 | #76 | Exceptional 10.0% |
| Immigrants | North Macedonia | 98.7 /100 | #77 | Exceptional 10.0% |
| South Africans | 98.7 /100 | #78 | Exceptional 10.0% |
| Laotians | 98.7 /100 | #79 | Exceptional 10.0% |
| Poles | 98.6 /100 | #80 | Exceptional 10.0% |
| Immigrants | England | 98.6 /100 | #81 | Exceptional 10.0% |
| Austrians | 98.6 /100 | #82 | Exceptional 10.0% |
| Dutch | 98.6 /100 | #83 | Exceptional 10.0% |
| Immigrants | Israel | 98.5 /100 | #84 | Exceptional 10.0% |