Immigrants from Iraq vs Comanche 4 or more Vehicles in Household
COMPARE
Immigrants from Iraq
Comanche
4 or more Vehicles in Household
4 or more Vehicles in Household Comparison
Immigrants from Iraq
Comanche
6.5%
4 OR MORE VEHICLES IN HOUSEHOLD
79.4/ 100
METRIC RATING
142nd/ 347
METRIC RANK
6.8%
4 OR MORE VEHICLES IN HOUSEHOLD
94.8/ 100
METRIC RATING
120th/ 347
METRIC RANK
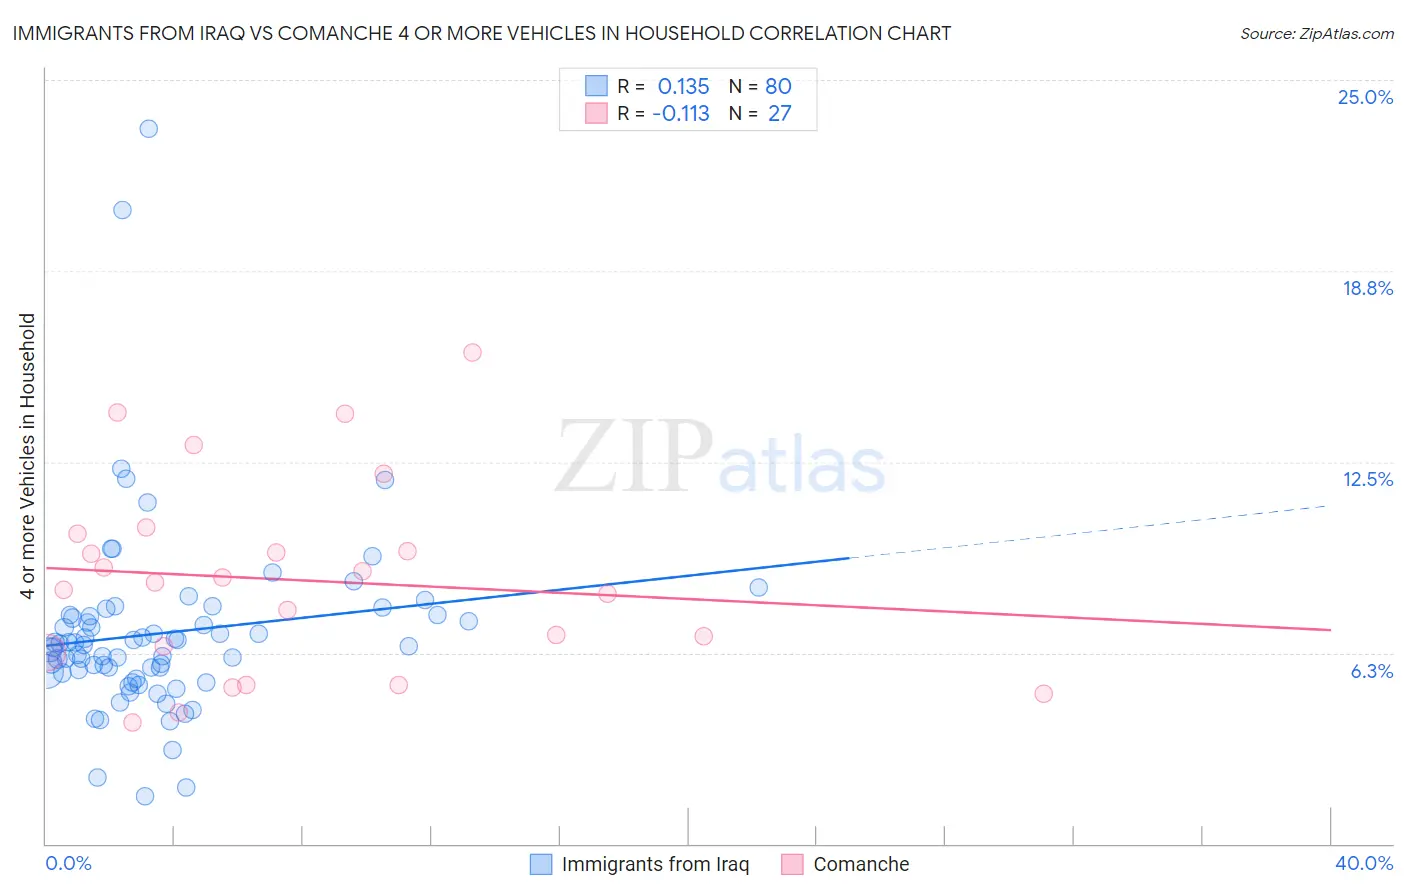
Immigrants from Iraq vs Comanche 4 or more Vehicles in Household Correlation Chart
The statistical analysis conducted on geographies consisting of 194,531,934 people shows a poor positive correlation between the proportion of Immigrants from Iraq and percentage of households with 4 or more vehicles available in the United States with a correlation coefficient (R) of 0.135 and weighted average of 6.5%. Similarly, the statistical analysis conducted on geographies consisting of 109,674,295 people shows a poor negative correlation between the proportion of Comanche and percentage of households with 4 or more vehicles available in the United States with a correlation coefficient (R) of -0.113 and weighted average of 6.8%, a difference of 3.8%.
4 or more Vehicles in Household Correlation Summary
| Measurement | Immigrants from Iraq | Comanche |
| Minimum | 1.6% | 4.0% |
| Maximum | 23.4% | 16.1% |
| Range | 21.8% | 12.1% |
| Mean | 6.9% | 8.6% |
| Median | 6.5% | 8.5% |
| Interquartile 25% (IQ1) | 5.6% | 6.2% |
| Interquartile 75% (IQ3) | 7.5% | 10.1% |
| Interquartile Range (IQR) | 1.9% | 3.9% |
| Standard Deviation (Sample) | 3.1% | 3.2% |
| Standard Deviation (Population) | 3.1% | 3.1% |
Similar Demographics by 4 or more Vehicles in Household
Demographics Similar to Immigrants from Iraq by 4 or more Vehicles in Household
In terms of 4 or more vehicles in household, the demographic groups most similar to Immigrants from Iraq are Immigrants from Canada (6.5%, a difference of 0.13%), Immigrants from North America (6.5%, a difference of 0.15%), Australian (6.6%, a difference of 0.20%), Croatian (6.5%, a difference of 0.25%), and Slavic (6.6%, a difference of 0.33%).
| Demographics | Rating | Rank | 4 or more Vehicles in Household |
| Tohono O'odham | 86.7 /100 | #135 | Excellent 6.6% |
| Luxembourgers | 86.4 /100 | #136 | Excellent 6.6% |
| French Canadians | 85.4 /100 | #137 | Excellent 6.6% |
| Italians | 84.5 /100 | #138 | Excellent 6.6% |
| Jordanians | 82.1 /100 | #139 | Excellent 6.6% |
| Slavs | 81.6 /100 | #140 | Excellent 6.6% |
| Australians | 80.8 /100 | #141 | Excellent 6.6% |
| Immigrants | Iraq | 79.4 /100 | #142 | Good 6.5% |
| Immigrants | Canada | 78.6 /100 | #143 | Good 6.5% |
| Immigrants | North America | 78.5 /100 | #144 | Good 6.5% |
| Croatians | 77.8 /100 | #145 | Good 6.5% |
| Immigrants | Costa Rica | 74.4 /100 | #146 | Good 6.5% |
| Immigrants | Iran | 73.9 /100 | #147 | Good 6.5% |
| Immigrants | Jordan | 73.7 /100 | #148 | Good 6.5% |
| Greeks | 73.6 /100 | #149 | Good 6.5% |
Demographics Similar to Comanche by 4 or more Vehicles in Household
In terms of 4 or more vehicles in household, the demographic groups most similar to Comanche are Immigrants from Germany (6.8%, a difference of 0.060%), Immigrants from Nicaragua (6.8%, a difference of 0.060%), Immigrants (6.8%, a difference of 0.13%), Immigrants from Asia (6.8%, a difference of 0.23%), and Austrian (6.8%, a difference of 0.32%).
| Demographics | Rating | Rank | 4 or more Vehicles in Household |
| Canadians | 96.4 /100 | #113 | Exceptional 6.9% |
| Bolivians | 96.3 /100 | #114 | Exceptional 6.8% |
| Tlingit-Haida | 96.2 /100 | #115 | Exceptional 6.8% |
| Immigrants | Guatemala | 95.8 /100 | #116 | Exceptional 6.8% |
| Burmese | 95.7 /100 | #117 | Exceptional 6.8% |
| French American Indians | 95.7 /100 | #118 | Exceptional 6.8% |
| Costa Ricans | 95.5 /100 | #119 | Exceptional 6.8% |
| Comanche | 94.8 /100 | #120 | Exceptional 6.8% |
| Immigrants | Germany | 94.7 /100 | #121 | Exceptional 6.8% |
| Immigrants | Nicaragua | 94.7 /100 | #122 | Exceptional 6.8% |
| Immigrants | Immigrants | 94.6 /100 | #123 | Exceptional 6.8% |
| Immigrants | Asia | 94.4 /100 | #124 | Exceptional 6.8% |
| Austrians | 94.1 /100 | #125 | Exceptional 6.8% |
| Belgians | 94.1 /100 | #126 | Exceptional 6.8% |
| Immigrants | Korea | 93.8 /100 | #127 | Exceptional 6.8% |