Immigrants from Iraq vs Immigrants from Armenia 4 or more Vehicles in Household
COMPARE
Immigrants from Iraq
Immigrants from Armenia
4 or more Vehicles in Household
4 or more Vehicles in Household Comparison
Immigrants from Iraq
Immigrants from Armenia
6.5%
4 OR MORE VEHICLES IN HOUSEHOLD
79.4/ 100
METRIC RATING
142nd/ 347
METRIC RANK
6.5%
4 OR MORE VEHICLES IN HOUSEHOLD
71.2/ 100
METRIC RATING
153rd/ 347
METRIC RANK
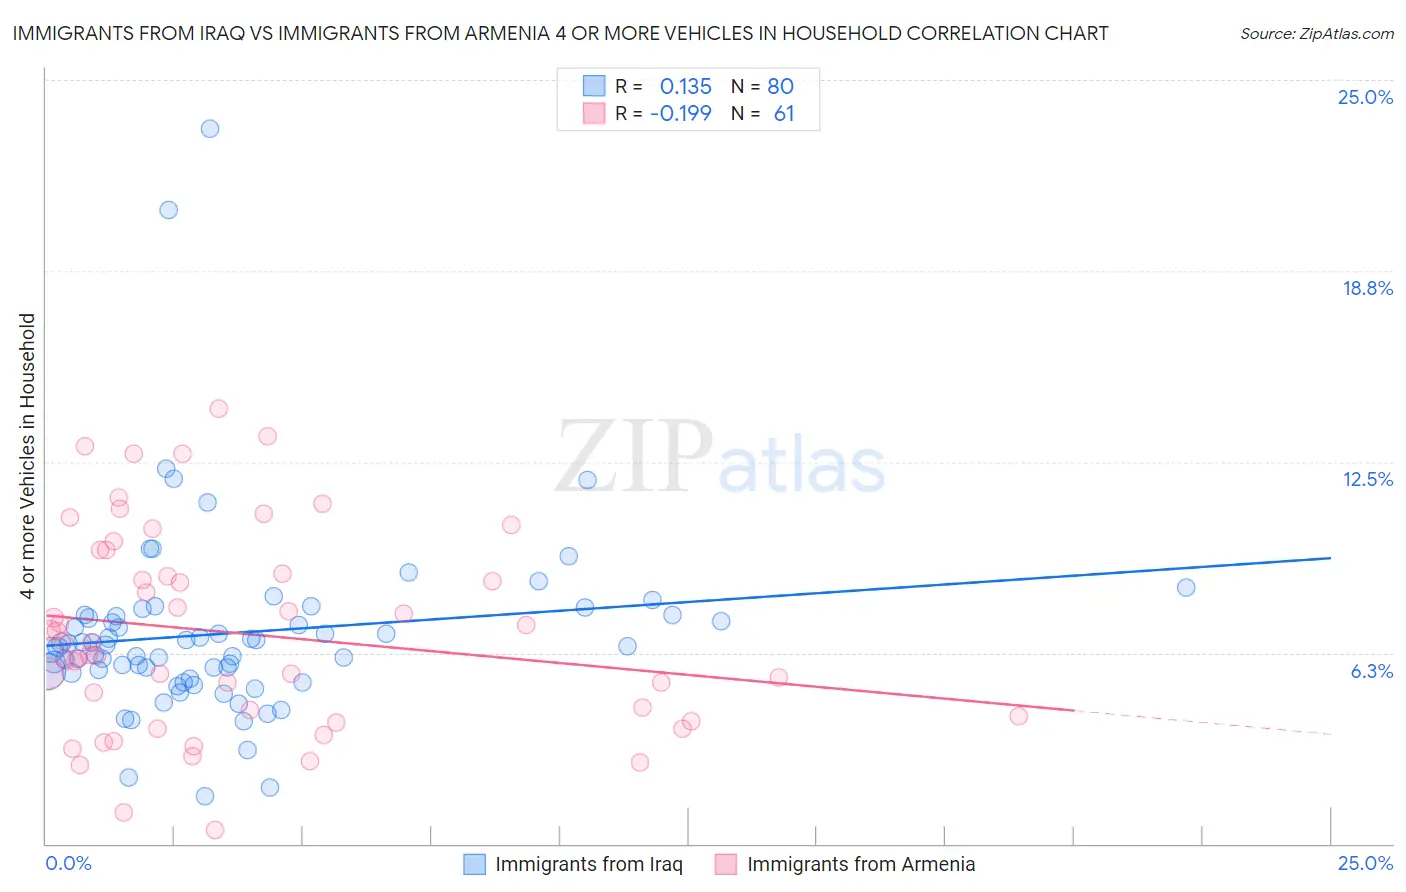
Immigrants from Iraq vs Immigrants from Armenia 4 or more Vehicles in Household Correlation Chart
The statistical analysis conducted on geographies consisting of 194,531,934 people shows a poor positive correlation between the proportion of Immigrants from Iraq and percentage of households with 4 or more vehicles available in the United States with a correlation coefficient (R) of 0.135 and weighted average of 6.5%. Similarly, the statistical analysis conducted on geographies consisting of 97,454,619 people shows a poor negative correlation between the proportion of Immigrants from Armenia and percentage of households with 4 or more vehicles available in the United States with a correlation coefficient (R) of -0.199 and weighted average of 6.5%, a difference of 1.1%.
4 or more Vehicles in Household Correlation Summary
| Measurement | Immigrants from Iraq | Immigrants from Armenia |
| Minimum | 1.6% | 0.45% |
| Maximum | 23.4% | 14.3% |
| Range | 21.8% | 13.8% |
| Mean | 6.9% | 6.9% |
| Median | 6.5% | 6.6% |
| Interquartile 25% (IQ1) | 5.6% | 4.1% |
| Interquartile 75% (IQ3) | 7.5% | 9.2% |
| Interquartile Range (IQR) | 1.9% | 5.1% |
| Standard Deviation (Sample) | 3.1% | 3.3% |
| Standard Deviation (Population) | 3.1% | 3.2% |
Demographics Similar to Immigrants from Iraq and Immigrants from Armenia by 4 or more Vehicles in Household
In terms of 4 or more vehicles in household, the demographic groups most similar to Immigrants from Iraq are Immigrants from Canada (6.5%, a difference of 0.13%), Immigrants from North America (6.5%, a difference of 0.15%), Australian (6.6%, a difference of 0.20%), Croatian (6.5%, a difference of 0.25%), and Slavic (6.6%, a difference of 0.33%). Similarly, the demographic groups most similar to Immigrants from Armenia are Central American Indian (6.5%, a difference of 0.010%), Iroquois (6.5%, a difference of 0.090%), Yuman (6.5%, a difference of 0.11%), Immigrants from Hong Kong (6.5%, a difference of 0.13%), and Iranian (6.5%, a difference of 0.16%).
| Demographics | Rating | Rank | 4 or more Vehicles in Household |
| French Canadians | 85.4 /100 | #137 | Excellent 6.6% |
| Italians | 84.5 /100 | #138 | Excellent 6.6% |
| Jordanians | 82.1 /100 | #139 | Excellent 6.6% |
| Slavs | 81.6 /100 | #140 | Excellent 6.6% |
| Australians | 80.8 /100 | #141 | Excellent 6.6% |
| Immigrants | Iraq | 79.4 /100 | #142 | Good 6.5% |
| Immigrants | Canada | 78.6 /100 | #143 | Good 6.5% |
| Immigrants | North America | 78.5 /100 | #144 | Good 6.5% |
| Croatians | 77.8 /100 | #145 | Good 6.5% |
| Immigrants | Costa Rica | 74.4 /100 | #146 | Good 6.5% |
| Immigrants | Iran | 73.9 /100 | #147 | Good 6.5% |
| Immigrants | Jordan | 73.7 /100 | #148 | Good 6.5% |
| Greeks | 73.6 /100 | #149 | Good 6.5% |
| New Zealanders | 73.3 /100 | #150 | Good 6.5% |
| Immigrants | Hong Kong | 72.2 /100 | #151 | Good 6.5% |
| Yuman | 72.1 /100 | #152 | Good 6.5% |
| Immigrants | Armenia | 71.2 /100 | #153 | Good 6.5% |
| Central American Indians | 71.1 /100 | #154 | Good 6.5% |
| Iroquois | 70.4 /100 | #155 | Good 6.5% |
| Iranians | 69.9 /100 | #156 | Good 6.5% |
| Peruvians | 69.4 /100 | #157 | Good 6.5% |