Immigrants from Iraq vs Albanian 4 or more Vehicles in Household
COMPARE
Immigrants from Iraq
Albanian
4 or more Vehicles in Household
4 or more Vehicles in Household Comparison
Immigrants from Iraq
Albanians
6.5%
4 OR MORE VEHICLES IN HOUSEHOLD
79.4/ 100
METRIC RATING
142nd/ 347
METRIC RANK
4.8%
4 OR MORE VEHICLES IN HOUSEHOLD
0.0/ 100
METRIC RATING
312th/ 347
METRIC RANK
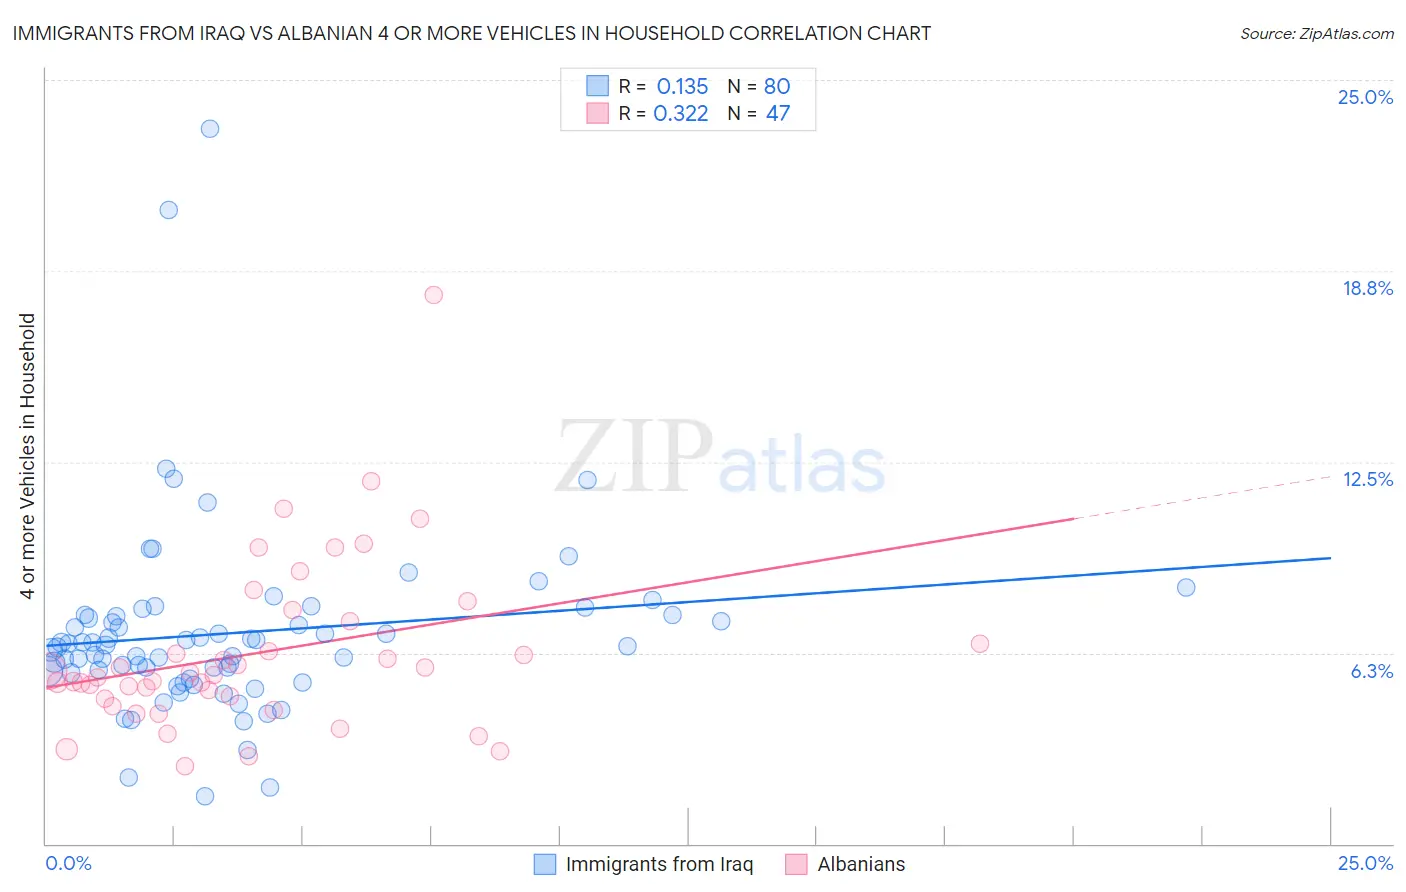
Immigrants from Iraq vs Albanian 4 or more Vehicles in Household Correlation Chart
The statistical analysis conducted on geographies consisting of 194,531,934 people shows a poor positive correlation between the proportion of Immigrants from Iraq and percentage of households with 4 or more vehicles available in the United States with a correlation coefficient (R) of 0.135 and weighted average of 6.5%. Similarly, the statistical analysis conducted on geographies consisting of 192,343,079 people shows a mild positive correlation between the proportion of Albanians and percentage of households with 4 or more vehicles available in the United States with a correlation coefficient (R) of 0.322 and weighted average of 4.8%, a difference of 36.7%.
4 or more Vehicles in Household Correlation Summary
| Measurement | Immigrants from Iraq | Albanian |
| Minimum | 1.6% | 2.5% |
| Maximum | 23.4% | 18.0% |
| Range | 21.8% | 15.5% |
| Mean | 6.9% | 6.3% |
| Median | 6.5% | 5.5% |
| Interquartile 25% (IQ1) | 5.6% | 4.7% |
| Interquartile 75% (IQ3) | 7.5% | 7.3% |
| Interquartile Range (IQR) | 1.9% | 2.5% |
| Standard Deviation (Sample) | 3.1% | 2.8% |
| Standard Deviation (Population) | 3.1% | 2.8% |
Similar Demographics by 4 or more Vehicles in Household
Demographics Similar to Immigrants from Iraq by 4 or more Vehicles in Household
In terms of 4 or more vehicles in household, the demographic groups most similar to Immigrants from Iraq are Immigrants from Canada (6.5%, a difference of 0.13%), Immigrants from North America (6.5%, a difference of 0.15%), Australian (6.6%, a difference of 0.20%), Croatian (6.5%, a difference of 0.25%), and Slavic (6.6%, a difference of 0.33%).
| Demographics | Rating | Rank | 4 or more Vehicles in Household |
| Tohono O'odham | 86.7 /100 | #135 | Excellent 6.6% |
| Luxembourgers | 86.4 /100 | #136 | Excellent 6.6% |
| French Canadians | 85.4 /100 | #137 | Excellent 6.6% |
| Italians | 84.5 /100 | #138 | Excellent 6.6% |
| Jordanians | 82.1 /100 | #139 | Excellent 6.6% |
| Slavs | 81.6 /100 | #140 | Excellent 6.6% |
| Australians | 80.8 /100 | #141 | Excellent 6.6% |
| Immigrants | Iraq | 79.4 /100 | #142 | Good 6.5% |
| Immigrants | Canada | 78.6 /100 | #143 | Good 6.5% |
| Immigrants | North America | 78.5 /100 | #144 | Good 6.5% |
| Croatians | 77.8 /100 | #145 | Good 6.5% |
| Immigrants | Costa Rica | 74.4 /100 | #146 | Good 6.5% |
| Immigrants | Iran | 73.9 /100 | #147 | Good 6.5% |
| Immigrants | Jordan | 73.7 /100 | #148 | Good 6.5% |
| Greeks | 73.6 /100 | #149 | Good 6.5% |
Demographics Similar to Albanians by 4 or more Vehicles in Household
In terms of 4 or more vehicles in household, the demographic groups most similar to Albanians are Immigrants from Israel (4.8%, a difference of 0.010%), Immigrants from West Indies (4.7%, a difference of 0.81%), Immigrants from Belarus (4.7%, a difference of 0.90%), Puerto Rican (4.7%, a difference of 1.3%), and Houma (4.9%, a difference of 2.7%).
| Demographics | Rating | Rank | 4 or more Vehicles in Household |
| Somalis | 0.0 /100 | #305 | Tragic 5.0% |
| Immigrants | Serbia | 0.0 /100 | #306 | Tragic 5.0% |
| Menominee | 0.0 /100 | #307 | Tragic 5.0% |
| Paraguayans | 0.0 /100 | #308 | Tragic 4.9% |
| Immigrants | Somalia | 0.0 /100 | #309 | Tragic 4.9% |
| Moroccans | 0.0 /100 | #310 | Tragic 4.9% |
| Houma | 0.0 /100 | #311 | Tragic 4.9% |
| Albanians | 0.0 /100 | #312 | Tragic 4.8% |
| Immigrants | Israel | 0.0 /100 | #313 | Tragic 4.8% |
| Immigrants | West Indies | 0.0 /100 | #314 | Tragic 4.7% |
| Immigrants | Belarus | 0.0 /100 | #315 | Tragic 4.7% |
| Puerto Ricans | 0.0 /100 | #316 | Tragic 4.7% |
| U.S. Virgin Islanders | 0.0 /100 | #317 | Tragic 4.6% |
| Jamaicans | 0.0 /100 | #318 | Tragic 4.6% |
| Haitians | 0.0 /100 | #319 | Tragic 4.6% |