Immigrants from Czechoslovakia vs Yuman 4 or more Vehicles in Household
COMPARE
Immigrants from Czechoslovakia
Yuman
4 or more Vehicles in Household
4 or more Vehicles in Household Comparison
Immigrants from Czechoslovakia
Yuman
5.8%
4 OR MORE VEHICLES IN HOUSEHOLD
3.2/ 100
METRIC RATING
243rd/ 347
METRIC RANK
6.5%
4 OR MORE VEHICLES IN HOUSEHOLD
72.1/ 100
METRIC RATING
152nd/ 347
METRIC RANK
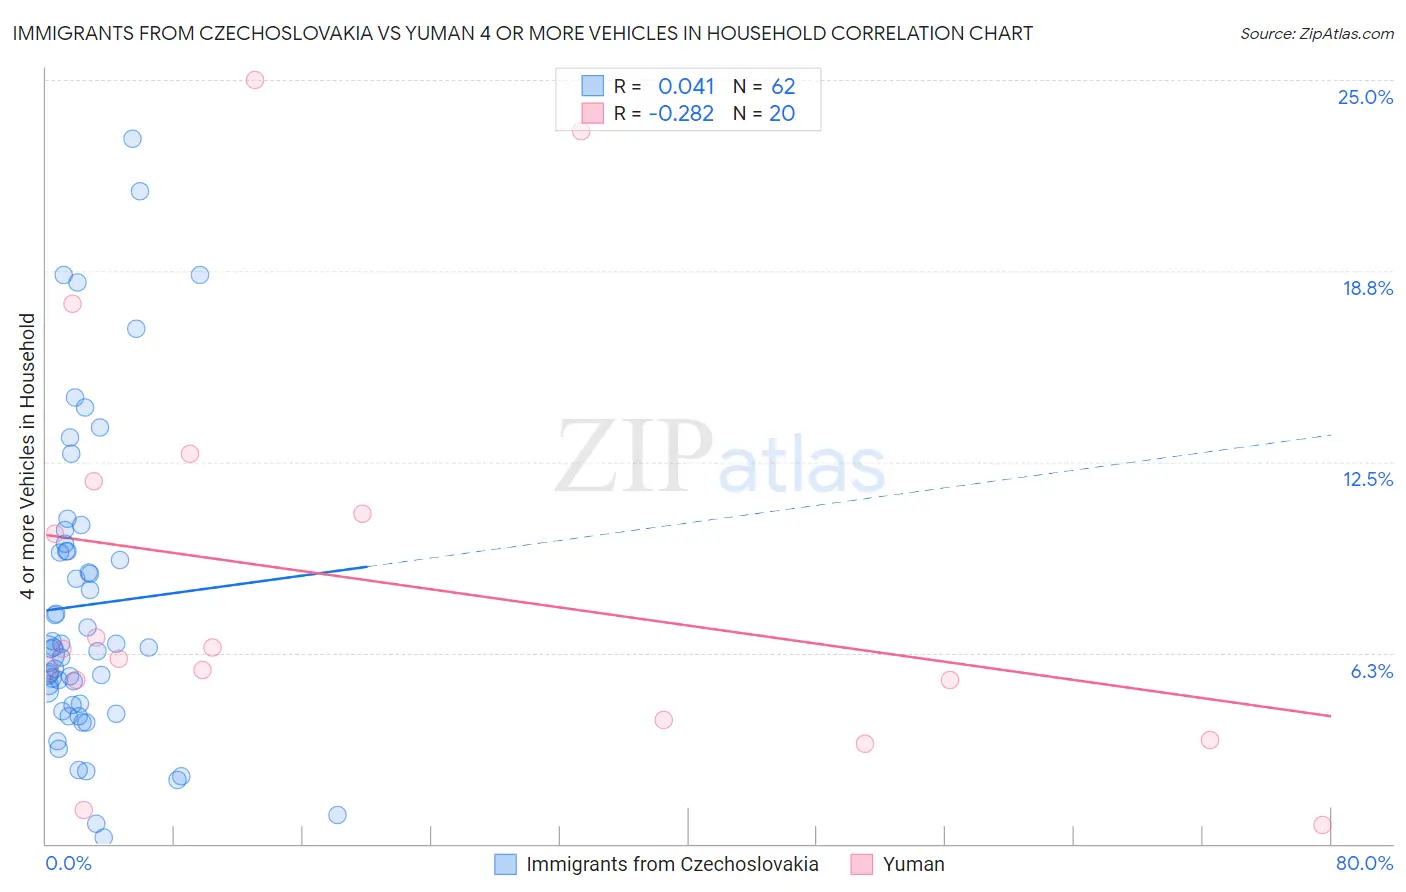
Immigrants from Czechoslovakia vs Yuman 4 or more Vehicles in Household Correlation Chart
The statistical analysis conducted on geographies consisting of 194,652,046 people shows no correlation between the proportion of Immigrants from Czechoslovakia and percentage of households with 4 or more vehicles available in the United States with a correlation coefficient (R) of 0.041 and weighted average of 5.8%. Similarly, the statistical analysis conducted on geographies consisting of 40,628,195 people shows a weak negative correlation between the proportion of Yuman and percentage of households with 4 or more vehicles available in the United States with a correlation coefficient (R) of -0.282 and weighted average of 6.5%, a difference of 12.1%.
4 or more Vehicles in Household Correlation Summary
| Measurement | Immigrants from Czechoslovakia | Yuman |
| Minimum | 0.19% | 0.62% |
| Maximum | 23.1% | 25.0% |
| Range | 22.9% | 24.4% |
| Mean | 7.8% | 8.6% |
| Median | 6.4% | 6.2% |
| Interquartile 25% (IQ1) | 4.5% | 4.7% |
| Interquartile 75% (IQ3) | 9.6% | 11.3% |
| Interquartile Range (IQR) | 5.1% | 6.6% |
| Standard Deviation (Sample) | 5.1% | 6.7% |
| Standard Deviation (Population) | 5.0% | 6.5% |
Similar Demographics by 4 or more Vehicles in Household
Demographics Similar to Immigrants from Czechoslovakia by 4 or more Vehicles in Household
In terms of 4 or more vehicles in household, the demographic groups most similar to Immigrants from Czechoslovakia are Ethiopian (5.8%, a difference of 0.010%), Bulgarian (5.8%, a difference of 0.050%), Immigrants from Middle Africa (5.8%, a difference of 0.19%), Mongolian (5.8%, a difference of 0.40%), and Immigrants from Poland (5.8%, a difference of 0.49%).
| Demographics | Rating | Rank | 4 or more Vehicles in Household |
| Immigrants | Eritrea | 4.5 /100 | #236 | Tragic 5.8% |
| Turks | 4.1 /100 | #237 | Tragic 5.8% |
| Immigrants | Belgium | 4.0 /100 | #238 | Tragic 5.8% |
| Immigrants | Australia | 3.8 /100 | #239 | Tragic 5.8% |
| Immigrants | Poland | 3.8 /100 | #240 | Tragic 5.8% |
| Mongolians | 3.7 /100 | #241 | Tragic 5.8% |
| Immigrants | Middle Africa | 3.4 /100 | #242 | Tragic 5.8% |
| Immigrants | Czechoslovakia | 3.2 /100 | #243 | Tragic 5.8% |
| Ethiopians | 3.2 /100 | #244 | Tragic 5.8% |
| Bulgarians | 3.1 /100 | #245 | Tragic 5.8% |
| Immigrants | North Macedonia | 2.5 /100 | #246 | Tragic 5.7% |
| Immigrants | Ethiopia | 2.4 /100 | #247 | Tragic 5.7% |
| Immigrants | Eastern Africa | 2.4 /100 | #248 | Tragic 5.7% |
| Immigrants | Southern Europe | 2.3 /100 | #249 | Tragic 5.7% |
| Immigrants | Europe | 2.3 /100 | #250 | Tragic 5.7% |
Demographics Similar to Yuman by 4 or more Vehicles in Household
In terms of 4 or more vehicles in household, the demographic groups most similar to Yuman are Immigrants from Hong Kong (6.5%, a difference of 0.010%), Immigrants from Armenia (6.5%, a difference of 0.11%), Central American Indian (6.5%, a difference of 0.13%), New Zealander (6.5%, a difference of 0.15%), and Immigrants from Jordan (6.5%, a difference of 0.19%).
| Demographics | Rating | Rank | 4 or more Vehicles in Household |
| Croatians | 77.8 /100 | #145 | Good 6.5% |
| Immigrants | Costa Rica | 74.4 /100 | #146 | Good 6.5% |
| Immigrants | Iran | 73.9 /100 | #147 | Good 6.5% |
| Immigrants | Jordan | 73.7 /100 | #148 | Good 6.5% |
| Greeks | 73.6 /100 | #149 | Good 6.5% |
| New Zealanders | 73.3 /100 | #150 | Good 6.5% |
| Immigrants | Hong Kong | 72.2 /100 | #151 | Good 6.5% |
| Yuman | 72.1 /100 | #152 | Good 6.5% |
| Immigrants | Armenia | 71.2 /100 | #153 | Good 6.5% |
| Central American Indians | 71.1 /100 | #154 | Good 6.5% |
| Iroquois | 70.4 /100 | #155 | Good 6.5% |
| Iranians | 69.9 /100 | #156 | Good 6.5% |
| Peruvians | 69.4 /100 | #157 | Good 6.5% |
| Zimbabweans | 67.1 /100 | #158 | Good 6.4% |
| Indians (Asian) | 66.3 /100 | #159 | Good 6.4% |