Immigrants from Indonesia vs Lithuanian Single Father Households
COMPARE
Immigrants from Indonesia
Lithuanian
Single Father Households
Single Father Households Comparison
Immigrants from Indonesia
Lithuanians
2.2%
SINGLE FATHER HOUSEHOLDS
97.4/ 100
METRIC RATING
125th/ 347
METRIC RANK
2.1%
SINGLE FATHER HOUSEHOLDS
99.5/ 100
METRIC RATING
87th/ 347
METRIC RANK
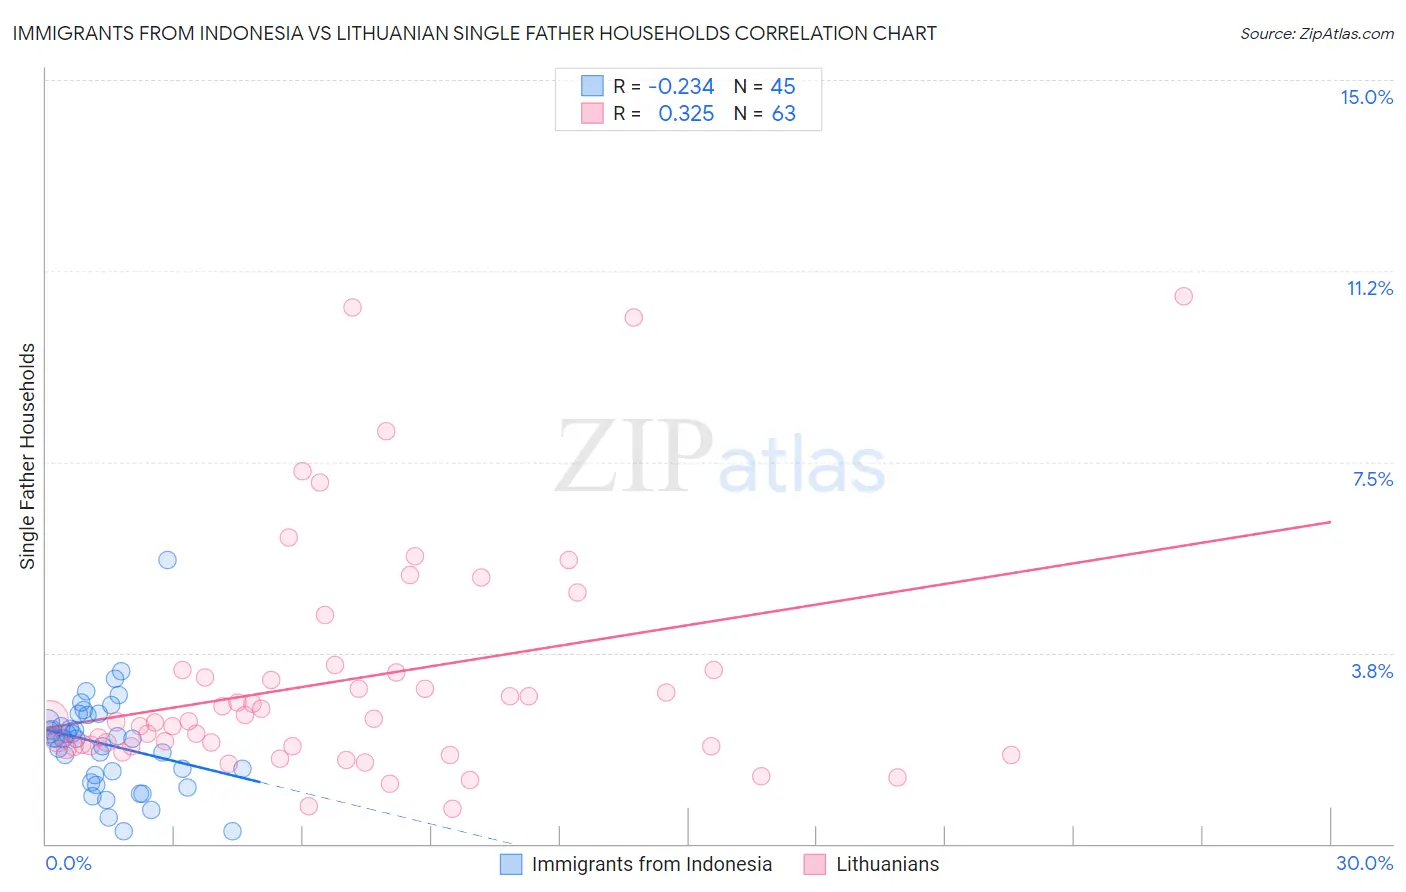
Immigrants from Indonesia vs Lithuanian Single Father Households Correlation Chart
The statistical analysis conducted on geographies consisting of 214,943,478 people shows a weak negative correlation between the proportion of Immigrants from Indonesia and percentage of single father households in the United States with a correlation coefficient (R) of -0.234 and weighted average of 2.2%. Similarly, the statistical analysis conducted on geographies consisting of 416,616,302 people shows a mild positive correlation between the proportion of Lithuanians and percentage of single father households in the United States with a correlation coefficient (R) of 0.325 and weighted average of 2.1%, a difference of 3.4%.
Single Father Households Correlation Summary
| Measurement | Immigrants from Indonesia | Lithuanian |
| Minimum | 0.25% | 0.69% |
| Maximum | 5.6% | 10.7% |
| Range | 5.3% | 10.0% |
| Mean | 2.0% | 3.2% |
| Median | 2.1% | 2.4% |
| Interquartile 25% (IQ1) | 1.3% | 1.9% |
| Interquartile 75% (IQ3) | 2.5% | 3.4% |
| Interquartile Range (IQR) | 1.2% | 1.5% |
| Standard Deviation (Sample) | 0.94% | 2.3% |
| Standard Deviation (Population) | 0.93% | 2.3% |
Similar Demographics by Single Father Households
Demographics Similar to Immigrants from Indonesia by Single Father Households
In terms of single father households, the demographic groups most similar to Immigrants from Indonesia are British West Indian (2.2%, a difference of 0.050%), Immigrants from Yemen (2.2%, a difference of 0.070%), Immigrants from Iraq (2.2%, a difference of 0.22%), Moroccan (2.2%, a difference of 0.31%), and Jordanian (2.2%, a difference of 0.31%).
| Demographics | Rating | Rank | Single Father Households |
| Immigrants | Morocco | 97.8 /100 | #118 | Exceptional 2.2% |
| Trinidadians and Tobagonians | 97.8 /100 | #119 | Exceptional 2.2% |
| Australians | 97.7 /100 | #120 | Exceptional 2.2% |
| Immigrants | Brazil | 97.7 /100 | #121 | Exceptional 2.2% |
| Immigrants | Iraq | 97.6 /100 | #122 | Exceptional 2.2% |
| Immigrants | Yemen | 97.5 /100 | #123 | Exceptional 2.2% |
| British West Indians | 97.4 /100 | #124 | Exceptional 2.2% |
| Immigrants | Indonesia | 97.4 /100 | #125 | Exceptional 2.2% |
| Moroccans | 96.9 /100 | #126 | Exceptional 2.2% |
| Jordanians | 96.9 /100 | #127 | Exceptional 2.2% |
| Immigrants | England | 96.8 /100 | #128 | Exceptional 2.2% |
| Serbians | 96.8 /100 | #129 | Exceptional 2.2% |
| Immigrants | Chile | 96.7 /100 | #130 | Exceptional 2.2% |
| Immigrants | Jordan | 96.6 /100 | #131 | Exceptional 2.2% |
| Poles | 96.5 /100 | #132 | Exceptional 2.2% |
Demographics Similar to Lithuanians by Single Father Households
In terms of single father households, the demographic groups most similar to Lithuanians are Bhutanese (2.1%, a difference of 0.13%), Immigrants from Armenia (2.1%, a difference of 0.18%), Immigrants from Pakistan (2.1%, a difference of 0.19%), Immigrants from Guyana (2.1%, a difference of 0.43%), and Asian (2.1%, a difference of 0.51%).
| Demographics | Rating | Rank | Single Father Households |
| Immigrants | South Africa | 99.7 /100 | #80 | Exceptional 2.1% |
| Armenians | 99.7 /100 | #81 | Exceptional 2.1% |
| New Zealanders | 99.7 /100 | #82 | Exceptional 2.1% |
| Greeks | 99.7 /100 | #83 | Exceptional 2.1% |
| Carpatho Rusyns | 99.6 /100 | #84 | Exceptional 2.1% |
| Immigrants | Hungary | 99.6 /100 | #85 | Exceptional 2.1% |
| Asians | 99.6 /100 | #86 | Exceptional 2.1% |
| Lithuanians | 99.5 /100 | #87 | Exceptional 2.1% |
| Bhutanese | 99.5 /100 | #88 | Exceptional 2.1% |
| Immigrants | Armenia | 99.5 /100 | #89 | Exceptional 2.1% |
| Immigrants | Pakistan | 99.5 /100 | #90 | Exceptional 2.1% |
| Immigrants | Guyana | 99.4 /100 | #91 | Exceptional 2.1% |
| Romanians | 99.4 /100 | #92 | Exceptional 2.1% |
| Croatians | 99.3 /100 | #93 | Exceptional 2.1% |
| Ukrainians | 99.3 /100 | #94 | Exceptional 2.1% |