Immigrants from Indonesia vs Lithuanian Householder Income Ages 25 - 44 years
COMPARE
Immigrants from Indonesia
Lithuanian
Householder Income Ages 25 - 44 years
Householder Income Ages 25 - 44 years Comparison
Immigrants from Indonesia
Lithuanians
$107,627
HOUSEHOLDER INCOME AGES 25 - 44 YEARS
99.9/ 100
METRIC RATING
44th/ 347
METRIC RANK
$105,223
HOUSEHOLDER INCOME AGES 25 - 44 YEARS
99.7/ 100
METRIC RATING
61st/ 347
METRIC RANK
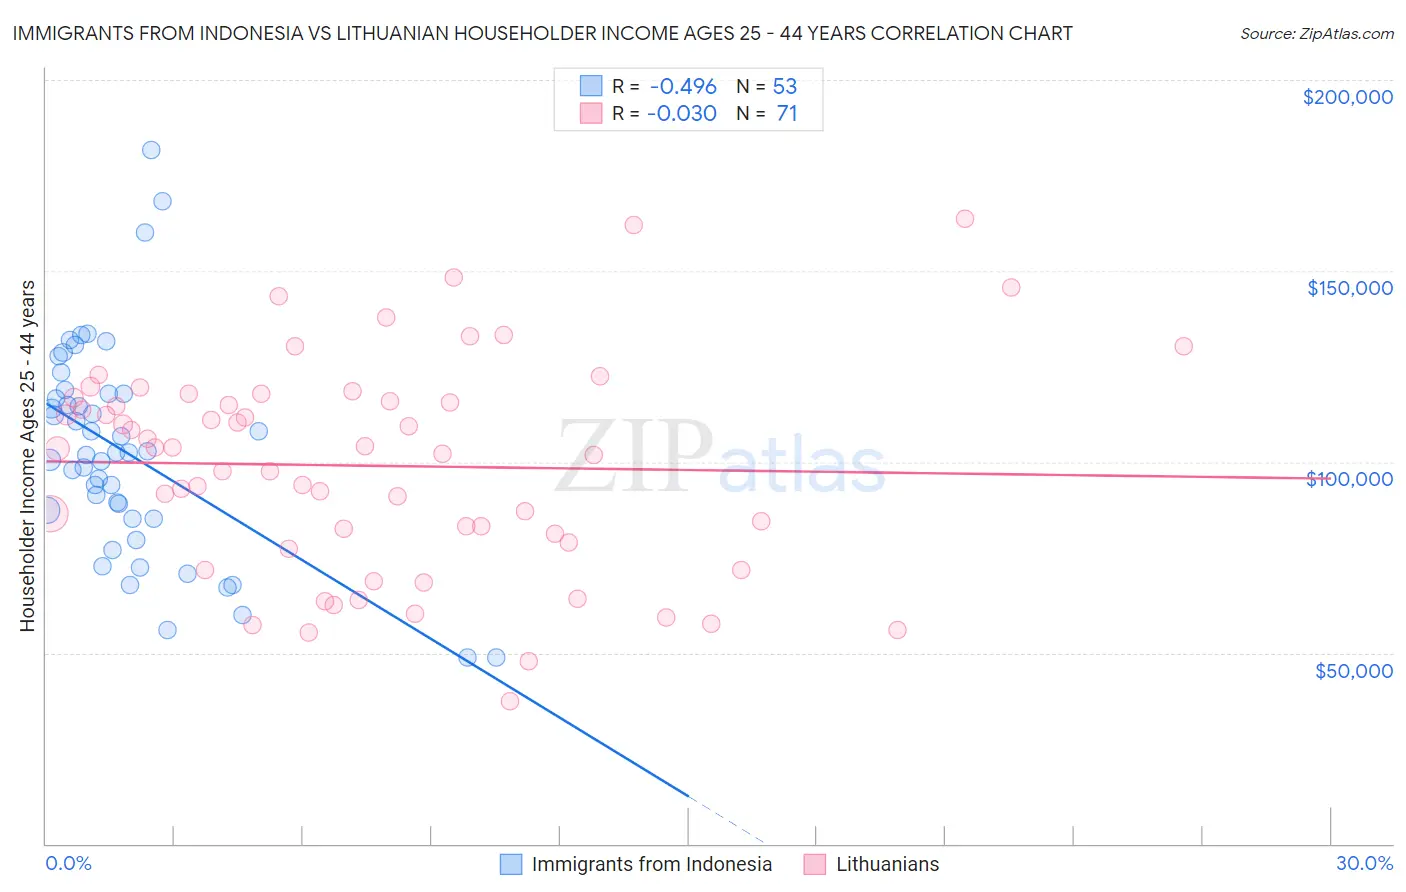
Immigrants from Indonesia vs Lithuanian Householder Income Ages 25 - 44 years Correlation Chart
The statistical analysis conducted on geographies consisting of 215,479,216 people shows a moderate negative correlation between the proportion of Immigrants from Indonesia and household income with householder between the ages 25 and 44 in the United States with a correlation coefficient (R) of -0.496 and weighted average of $107,627. Similarly, the statistical analysis conducted on geographies consisting of 420,458,262 people shows no correlation between the proportion of Lithuanians and household income with householder between the ages 25 and 44 in the United States with a correlation coefficient (R) of -0.030 and weighted average of $105,223, a difference of 2.3%.
Householder Income Ages 25 - 44 years Correlation Summary
| Measurement | Immigrants from Indonesia | Lithuanian |
| Minimum | $48,644 | $37,413 |
| Maximum | $181,667 | $163,542 |
| Range | $133,023 | $126,129 |
| Mean | $102,424 | $98,966 |
| Median | $102,321 | $103,489 |
| Interquartile 25% (IQ1) | $85,037 | $78,970 |
| Interquartile 75% (IQ3) | $117,969 | $116,848 |
| Interquartile Range (IQR) | $32,932 | $37,878 |
| Standard Deviation (Sample) | $28,015 | $27,829 |
| Standard Deviation (Population) | $27,749 | $27,632 |
Demographics Similar to Immigrants from Indonesia and Lithuanians by Householder Income Ages 25 - 44 years
In terms of householder income ages 25 - 44 years, the demographic groups most similar to Immigrants from Indonesia are Immigrants from Malaysia ($107,650, a difference of 0.020%), Israeli ($107,579, a difference of 0.040%), Immigrants from Belarus ($107,393, a difference of 0.22%), Australian ($107,912, a difference of 0.26%), and Estonian ($107,269, a difference of 0.33%). Similarly, the demographic groups most similar to Lithuanians are Immigrants from Italy ($105,201, a difference of 0.020%), Egyptian ($105,282, a difference of 0.060%), Immigrants from Latvia ($105,522, a difference of 0.28%), Immigrants from South Africa ($105,748, a difference of 0.50%), and Immigrants from Austria ($106,103, a difference of 0.84%).
| Demographics | Rating | Rank | Householder Income Ages 25 - 44 years |
| Australians | 99.9 /100 | #42 | Exceptional $107,912 |
| Immigrants | Malaysia | 99.9 /100 | #43 | Exceptional $107,650 |
| Immigrants | Indonesia | 99.9 /100 | #44 | Exceptional $107,627 |
| Israelis | 99.9 /100 | #45 | Exceptional $107,579 |
| Immigrants | Belarus | 99.9 /100 | #46 | Exceptional $107,393 |
| Estonians | 99.9 /100 | #47 | Exceptional $107,269 |
| Bulgarians | 99.9 /100 | #48 | Exceptional $107,264 |
| Immigrants | Turkey | 99.9 /100 | #49 | Exceptional $107,258 |
| Cambodians | 99.9 /100 | #50 | Exceptional $107,148 |
| Immigrants | Czechoslovakia | 99.9 /100 | #51 | Exceptional $106,888 |
| Immigrants | Europe | 99.9 /100 | #52 | Exceptional $106,817 |
| Immigrants | Norway | 99.9 /100 | #53 | Exceptional $106,629 |
| Paraguayans | 99.9 /100 | #54 | Exceptional $106,615 |
| Greeks | 99.9 /100 | #55 | Exceptional $106,457 |
| Immigrants | Pakistan | 99.8 /100 | #56 | Exceptional $106,129 |
| Immigrants | Austria | 99.8 /100 | #57 | Exceptional $106,103 |
| Immigrants | South Africa | 99.8 /100 | #58 | Exceptional $105,748 |
| Immigrants | Latvia | 99.8 /100 | #59 | Exceptional $105,522 |
| Egyptians | 99.7 /100 | #60 | Exceptional $105,282 |
| Lithuanians | 99.7 /100 | #61 | Exceptional $105,223 |
| Immigrants | Italy | 99.7 /100 | #62 | Exceptional $105,201 |