Immigrants from Greece vs Argentinean 3 or more Vehicles in Household
COMPARE
Immigrants from Greece
Argentinean
3 or more Vehicles in Household
3 or more Vehicles in Household Comparison
Immigrants from Greece
Argentineans
16.5%
3 OR MORE VEHICLES IN HOUSEHOLD
0.0/ 100
METRIC RATING
302nd/ 347
METRIC RANK
18.9%
3 OR MORE VEHICLES IN HOUSEHOLD
18.2/ 100
METRIC RATING
200th/ 347
METRIC RANK
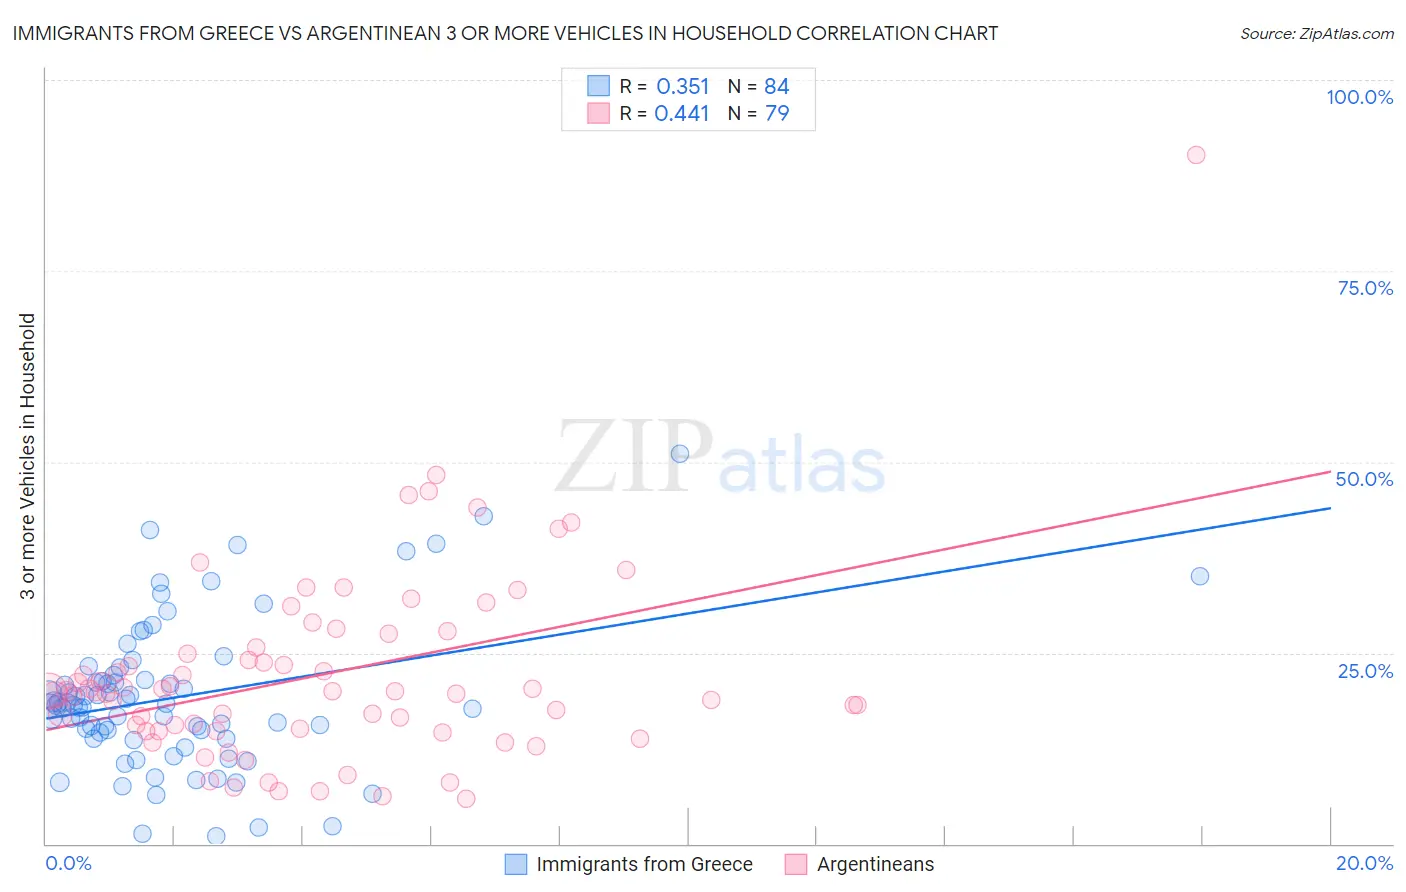
Immigrants from Greece vs Argentinean 3 or more Vehicles in Household Correlation Chart
The statistical analysis conducted on geographies consisting of 216,821,688 people shows a mild positive correlation between the proportion of Immigrants from Greece and percentage of households with 3 or more vehicles available in the United States with a correlation coefficient (R) of 0.351 and weighted average of 16.5%. Similarly, the statistical analysis conducted on geographies consisting of 296,926,248 people shows a moderate positive correlation between the proportion of Argentineans and percentage of households with 3 or more vehicles available in the United States with a correlation coefficient (R) of 0.441 and weighted average of 18.9%, a difference of 14.9%.
3 or more Vehicles in Household Correlation Summary
| Measurement | Immigrants from Greece | Argentinean |
| Minimum | 1.0% | 6.0% |
| Maximum | 51.1% | 90.2% |
| Range | 50.1% | 84.2% |
| Mean | 19.2% | 22.1% |
| Median | 18.2% | 19.9% |
| Interquartile 25% (IQ1) | 14.2% | 14.8% |
| Interquartile 75% (IQ3) | 21.8% | 25.6% |
| Interquartile Range (IQR) | 7.6% | 10.8% |
| Standard Deviation (Sample) | 9.7% | 12.5% |
| Standard Deviation (Population) | 9.6% | 12.4% |
Similar Demographics by 3 or more Vehicles in Household
Demographics Similar to Immigrants from Greece by 3 or more Vehicles in Household
In terms of 3 or more vehicles in household, the demographic groups most similar to Immigrants from Greece are Immigrants from Serbia (16.4%, a difference of 0.31%), Paraguayan (16.6%, a difference of 0.43%), Ghanaian (16.4%, a difference of 0.78%), Cypriot (16.6%, a difference of 0.83%), and Immigrants from Morocco (16.3%, a difference of 1.0%).
| Demographics | Rating | Rank | 3 or more Vehicles in Household |
| Immigrants | Russia | 0.1 /100 | #295 | Tragic 16.9% |
| Inupiat | 0.1 /100 | #296 | Tragic 16.9% |
| Israelis | 0.1 /100 | #297 | Tragic 16.8% |
| Immigrants | Zaire | 0.1 /100 | #298 | Tragic 16.7% |
| Immigrants | South America | 0.1 /100 | #299 | Tragic 16.7% |
| Cypriots | 0.0 /100 | #300 | Tragic 16.6% |
| Paraguayans | 0.0 /100 | #301 | Tragic 16.6% |
| Immigrants | Greece | 0.0 /100 | #302 | Tragic 16.5% |
| Immigrants | Serbia | 0.0 /100 | #303 | Tragic 16.4% |
| Ghanaians | 0.0 /100 | #304 | Tragic 16.4% |
| Immigrants | Morocco | 0.0 /100 | #305 | Tragic 16.3% |
| Somalis | 0.0 /100 | #306 | Tragic 16.2% |
| Immigrants | Ghana | 0.0 /100 | #307 | Tragic 16.2% |
| Houma | 0.0 /100 | #308 | Tragic 16.1% |
| Immigrants | Somalia | 0.0 /100 | #309 | Tragic 15.9% |
Demographics Similar to Argentineans by 3 or more Vehicles in Household
In terms of 3 or more vehicles in household, the demographic groups most similar to Argentineans are Arab (18.9%, a difference of 0.060%), Immigrants from Norway (19.0%, a difference of 0.10%), Egyptian (19.0%, a difference of 0.17%), Immigrants from Austria (18.9%, a difference of 0.39%), and Immigrants from Japan (19.0%, a difference of 0.46%).
| Demographics | Rating | Rank | 3 or more Vehicles in Household |
| Tsimshian | 24.4 /100 | #193 | Fair 19.1% |
| Serbians | 24.0 /100 | #194 | Fair 19.1% |
| Immigrants | Moldova | 23.6 /100 | #195 | Fair 19.1% |
| Central American Indians | 22.2 /100 | #196 | Fair 19.0% |
| Immigrants | Japan | 22.0 /100 | #197 | Fair 19.0% |
| Egyptians | 19.5 /100 | #198 | Poor 19.0% |
| Immigrants | Norway | 19.0 /100 | #199 | Poor 19.0% |
| Argentineans | 18.2 /100 | #200 | Poor 18.9% |
| Arabs | 17.7 /100 | #201 | Poor 18.9% |
| Immigrants | Austria | 15.4 /100 | #202 | Poor 18.9% |
| Tohono O'odham | 14.8 /100 | #203 | Poor 18.9% |
| Immigrants | Romania | 14.6 /100 | #204 | Poor 18.9% |
| Russians | 14.2 /100 | #205 | Poor 18.8% |
| Immigrants | Eastern Asia | 14.1 /100 | #206 | Poor 18.8% |
| Immigrants | Chile | 13.6 /100 | #207 | Poor 18.8% |