Immigrants from Fiji vs Immigrants from Africa 2 or more Vehicles in Household
COMPARE
Immigrants from Fiji
Immigrants from Africa
2 or more Vehicles in Household
2 or more Vehicles in Household Comparison
Immigrants from Fiji
Immigrants from Africa
62.3%
2 OR MORE VEHICLES IN HOUSEHOLD
100.0/ 100
METRIC RATING
5th/ 347
METRIC RANK
51.8%
2 OR MORE VEHICLES IN HOUSEHOLD
0.2/ 100
METRIC RATING
277th/ 347
METRIC RANK
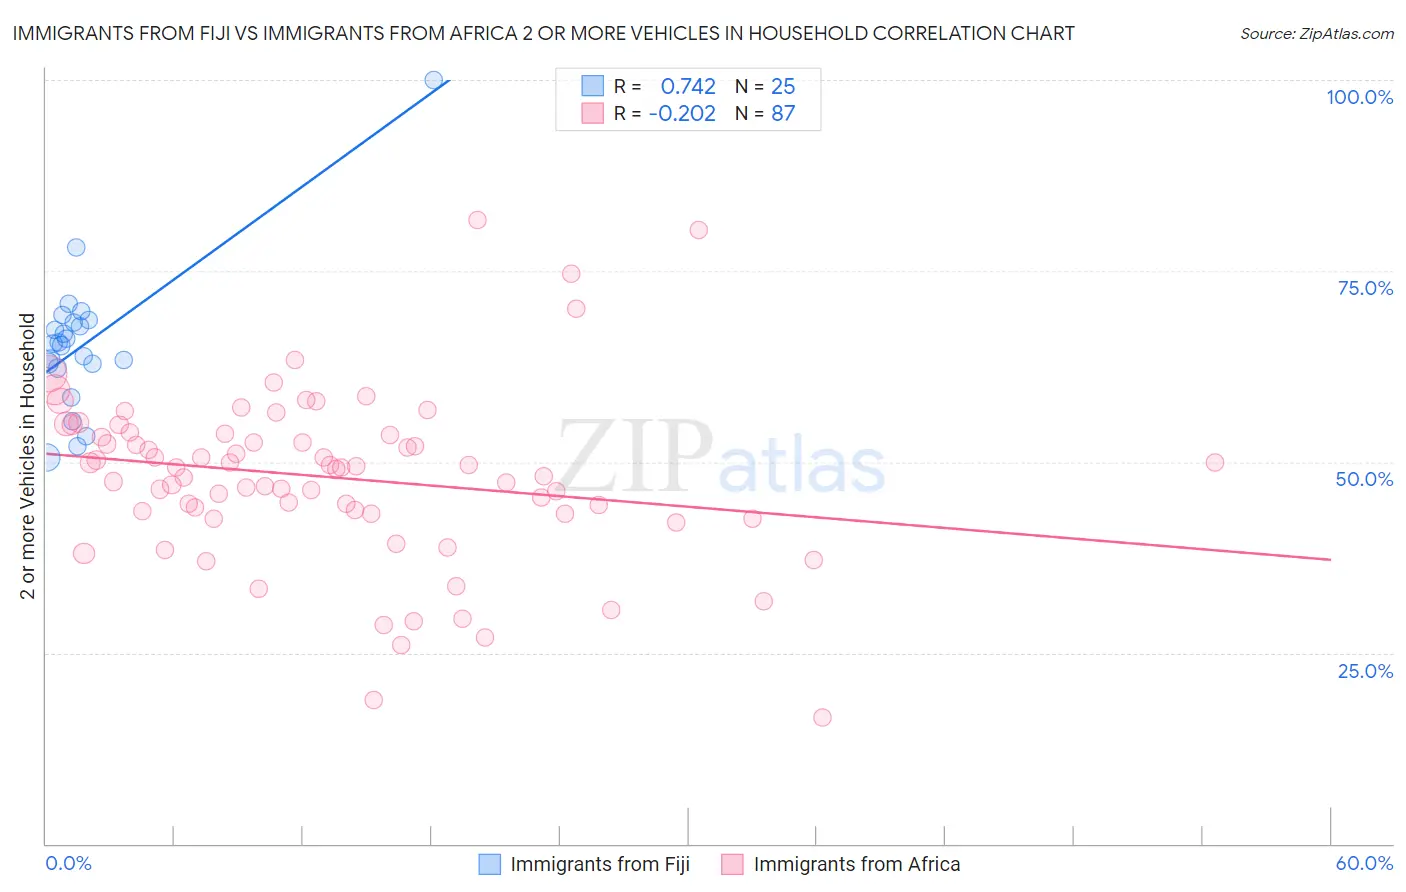
Immigrants from Fiji vs Immigrants from Africa 2 or more Vehicles in Household Correlation Chart
The statistical analysis conducted on geographies consisting of 93,754,900 people shows a strong positive correlation between the proportion of Immigrants from Fiji and percentage of households with 2 or more vehicles available in the United States with a correlation coefficient (R) of 0.742 and weighted average of 62.3%. Similarly, the statistical analysis conducted on geographies consisting of 468,994,559 people shows a weak negative correlation between the proportion of Immigrants from Africa and percentage of households with 2 or more vehicles available in the United States with a correlation coefficient (R) of -0.202 and weighted average of 51.8%, a difference of 20.3%.
2 or more Vehicles in Household Correlation Summary
| Measurement | Immigrants from Fiji | Immigrants from Africa |
| Minimum | 50.6% | 16.4% |
| Maximum | 100.0% | 81.7% |
| Range | 49.4% | 65.2% |
| Mean | 65.5% | 48.0% |
| Median | 65.5% | 49.2% |
| Interquartile 25% (IQ1) | 62.6% | 43.2% |
| Interquartile 75% (IQ3) | 68.4% | 53.7% |
| Interquartile Range (IQR) | 5.9% | 10.5% |
| Standard Deviation (Sample) | 9.5% | 11.3% |
| Standard Deviation (Population) | 9.3% | 11.2% |
Similar Demographics by 2 or more Vehicles in Household
Demographics Similar to Immigrants from Fiji by 2 or more Vehicles in Household
In terms of 2 or more vehicles in household, the demographic groups most similar to Immigrants from Fiji are Scandinavian (62.1%, a difference of 0.34%), Puget Sound Salish (62.1%, a difference of 0.40%), English (61.9%, a difference of 0.67%), Swedish (61.8%, a difference of 0.74%), and Norwegian (62.8%, a difference of 0.87%).
| Demographics | Rating | Rank | 2 or more Vehicles in Household |
| Yakama | 100.0 /100 | #1 | Exceptional 64.9% |
| Tongans | 100.0 /100 | #2 | Exceptional 63.5% |
| Danes | 100.0 /100 | #3 | Exceptional 63.3% |
| Norwegians | 100.0 /100 | #4 | Exceptional 62.8% |
| Immigrants | Fiji | 100.0 /100 | #5 | Exceptional 62.3% |
| Scandinavians | 100.0 /100 | #6 | Exceptional 62.1% |
| Puget Sound Salish | 100.0 /100 | #7 | Exceptional 62.1% |
| English | 100.0 /100 | #8 | Exceptional 61.9% |
| Swedes | 100.0 /100 | #9 | Exceptional 61.8% |
| Mexicans | 100.0 /100 | #10 | Exceptional 61.7% |
| Dutch | 100.0 /100 | #11 | Exceptional 61.6% |
| Germans | 100.0 /100 | #12 | Exceptional 61.6% |
| Samoans | 100.0 /100 | #13 | Exceptional 61.5% |
| Czechs | 100.0 /100 | #14 | Exceptional 61.5% |
| Nepalese | 100.0 /100 | #15 | Exceptional 61.4% |
Demographics Similar to Immigrants from Africa by 2 or more Vehicles in Household
In terms of 2 or more vehicles in household, the demographic groups most similar to Immigrants from Africa are Immigrants from Croatia (51.8%, a difference of 0.050%), Yuman (51.7%, a difference of 0.060%), Liberian (51.7%, a difference of 0.070%), Immigrants from Honduras (51.8%, a difference of 0.080%), and African (51.8%, a difference of 0.090%).
| Demographics | Rating | Rank | 2 or more Vehicles in Household |
| Immigrants | Ireland | 0.2 /100 | #270 | Tragic 52.0% |
| South Americans | 0.2 /100 | #271 | Tragic 51.9% |
| Sub-Saharan Africans | 0.2 /100 | #272 | Tragic 51.9% |
| Israelis | 0.2 /100 | #273 | Tragic 51.9% |
| Africans | 0.2 /100 | #274 | Tragic 51.8% |
| Immigrants | Honduras | 0.2 /100 | #275 | Tragic 51.8% |
| Immigrants | Croatia | 0.2 /100 | #276 | Tragic 51.8% |
| Immigrants | Africa | 0.2 /100 | #277 | Tragic 51.8% |
| Yuman | 0.1 /100 | #278 | Tragic 51.7% |
| Liberians | 0.1 /100 | #279 | Tragic 51.7% |
| Immigrants | Eastern Europe | 0.1 /100 | #280 | Tragic 51.7% |
| Immigrants | Kazakhstan | 0.1 /100 | #281 | Tragic 51.6% |
| Bahamians | 0.1 /100 | #282 | Tragic 51.5% |
| Immigrants | China | 0.1 /100 | #283 | Tragic 51.5% |
| Immigrants | Zaire | 0.1 /100 | #284 | Tragic 51.5% |