Immigrants from Fiji vs Laotian Median Earnings
COMPARE
Immigrants from Fiji
Laotian
Median Earnings
Median Earnings Comparison
Immigrants from Fiji
Laotians
$48,305
MEDIAN EARNINGS
93.3/ 100
METRIC RATING
125th/ 347
METRIC RANK
$50,343
MEDIAN EARNINGS
99.6/ 100
METRIC RATING
79th/ 347
METRIC RANK
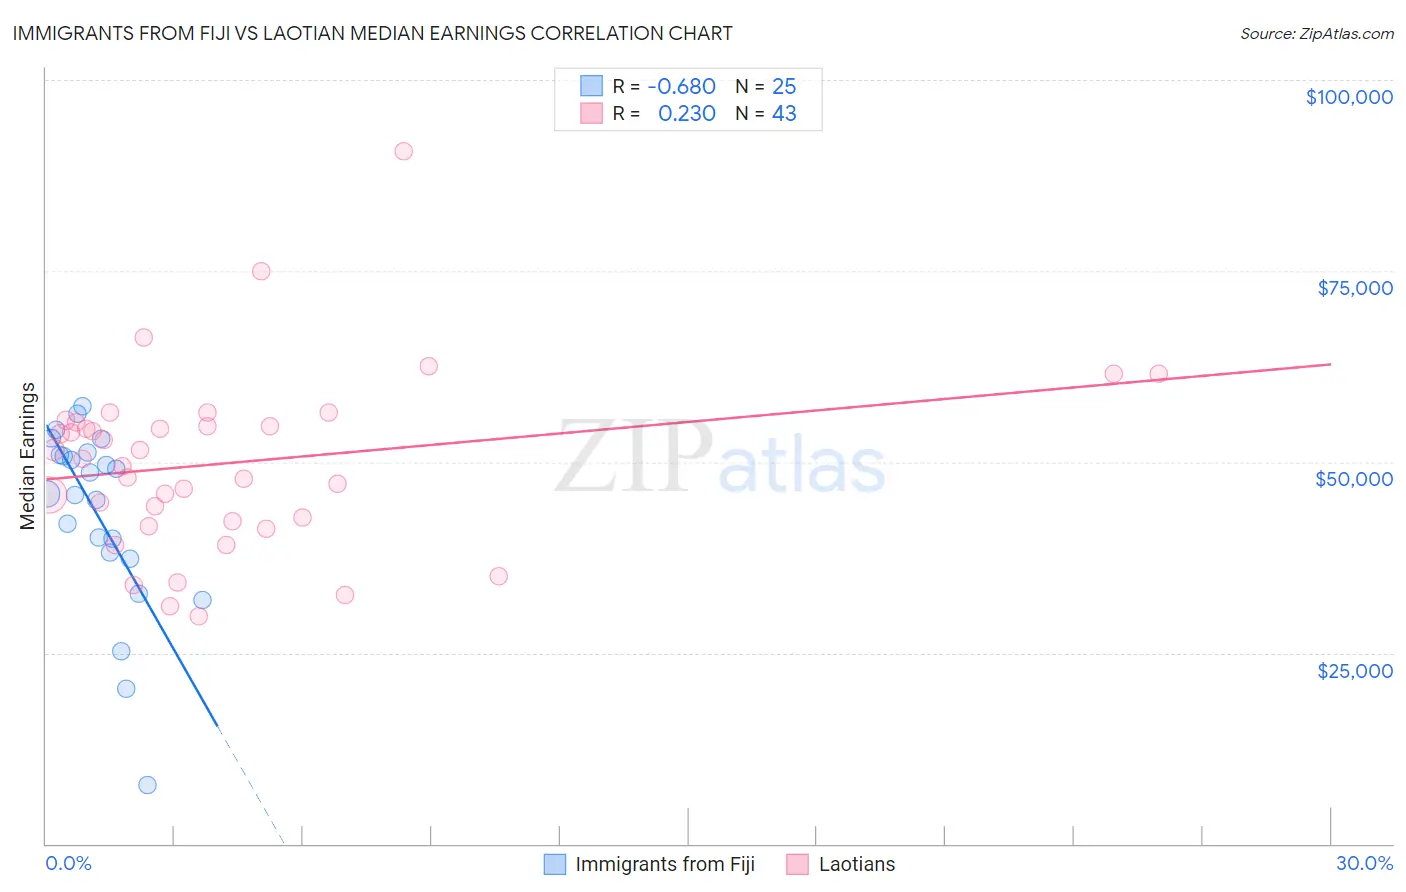
Immigrants from Fiji vs Laotian Median Earnings Correlation Chart
The statistical analysis conducted on geographies consisting of 93,756,016 people shows a significant negative correlation between the proportion of Immigrants from Fiji and median earnings in the United States with a correlation coefficient (R) of -0.680 and weighted average of $48,305. Similarly, the statistical analysis conducted on geographies consisting of 224,848,117 people shows a weak positive correlation between the proportion of Laotians and median earnings in the United States with a correlation coefficient (R) of 0.230 and weighted average of $50,343, a difference of 4.2%.
Median Earnings Correlation Summary
| Measurement | Immigrants from Fiji | Laotian |
| Minimum | $7,703 | $29,751 |
| Maximum | $57,229 | $90,729 |
| Range | $49,526 | $60,978 |
| Mean | $43,044 | $49,880 |
| Median | $45,776 | $50,359 |
| Interquartile 25% (IQ1) | $37,711 | $42,206 |
| Interquartile 75% (IQ3) | $51,118 | $55,106 |
| Interquartile Range (IQR) | $13,407 | $12,900 |
| Standard Deviation (Sample) | $12,014 | $11,670 |
| Standard Deviation (Population) | $11,772 | $11,533 |
Similar Demographics by Median Earnings
Demographics Similar to Immigrants from Fiji by Median Earnings
In terms of median earnings, the demographic groups most similar to Immigrants from Fiji are Assyrian/Chaldean/Syriac ($48,304, a difference of 0.0%), Sierra Leonean ($48,286, a difference of 0.040%), Immigrants from Philippines ($48,266, a difference of 0.080%), Brazilian ($48,356, a difference of 0.11%), and Pakistani ($48,254, a difference of 0.11%).
| Demographics | Rating | Rank | Median Earnings |
| Immigrants | Jordan | 95.9 /100 | #118 | Exceptional $48,673 |
| Poles | 95.8 /100 | #119 | Exceptional $48,659 |
| Carpatho Rusyns | 95.5 /100 | #120 | Exceptional $48,617 |
| Arabs | 95.4 /100 | #121 | Exceptional $48,599 |
| Chileans | 94.8 /100 | #122 | Exceptional $48,504 |
| Immigrants | Syria | 93.9 /100 | #123 | Exceptional $48,375 |
| Brazilians | 93.7 /100 | #124 | Exceptional $48,356 |
| Immigrants | Fiji | 93.3 /100 | #125 | Exceptional $48,305 |
| Assyrians/Chaldeans/Syriacs | 93.3 /100 | #126 | Exceptional $48,304 |
| Sierra Leoneans | 93.1 /100 | #127 | Exceptional $48,286 |
| Immigrants | Philippines | 92.9 /100 | #128 | Exceptional $48,266 |
| Pakistanis | 92.8 /100 | #129 | Exceptional $48,254 |
| Zimbabweans | 92.6 /100 | #130 | Exceptional $48,229 |
| Lebanese | 92.5 /100 | #131 | Exceptional $48,226 |
| British | 92.2 /100 | #132 | Exceptional $48,189 |
Demographics Similar to Laotians by Median Earnings
In terms of median earnings, the demographic groups most similar to Laotians are Ukrainian ($50,320, a difference of 0.050%), Argentinean ($50,399, a difference of 0.11%), Immigrants from Southern Europe ($50,280, a difference of 0.12%), Immigrants from Moldova ($50,274, a difference of 0.14%), and Romanian ($50,244, a difference of 0.20%).
| Demographics | Rating | Rank | Median Earnings |
| Immigrants | Egypt | 99.8 /100 | #72 | Exceptional $50,901 |
| Immigrants | Netherlands | 99.8 /100 | #73 | Exceptional $50,818 |
| South Africans | 99.8 /100 | #74 | Exceptional $50,752 |
| Immigrants | Scotland | 99.8 /100 | #75 | Exceptional $50,741 |
| Immigrants | Italy | 99.7 /100 | #76 | Exceptional $50,581 |
| Immigrants | Western Europe | 99.7 /100 | #77 | Exceptional $50,549 |
| Argentineans | 99.6 /100 | #78 | Exceptional $50,399 |
| Laotians | 99.6 /100 | #79 | Exceptional $50,343 |
| Ukrainians | 99.6 /100 | #80 | Exceptional $50,320 |
| Immigrants | Southern Europe | 99.6 /100 | #81 | Exceptional $50,280 |
| Immigrants | Moldova | 99.5 /100 | #82 | Exceptional $50,274 |
| Romanians | 99.5 /100 | #83 | Exceptional $50,244 |
| Immigrants | Hungary | 99.5 /100 | #84 | Exceptional $50,227 |
| Immigrants | Kazakhstan | 99.5 /100 | #85 | Exceptional $50,225 |
| Immigrants | Canada | 99.5 /100 | #86 | Exceptional $50,192 |