Immigrants from Europe vs Immigrants from Kenya Householder Income Ages 25 - 44 years
COMPARE
Immigrants from Europe
Immigrants from Kenya
Householder Income Ages 25 - 44 years
Householder Income Ages 25 - 44 years Comparison
Immigrants from Europe
Immigrants from Kenya
$106,817
HOUSEHOLDER INCOME AGES 25 - 44 YEARS
99.9/ 100
METRIC RATING
52nd/ 347
METRIC RANK
$90,767
HOUSEHOLDER INCOME AGES 25 - 44 YEARS
10.9/ 100
METRIC RATING
210th/ 347
METRIC RANK
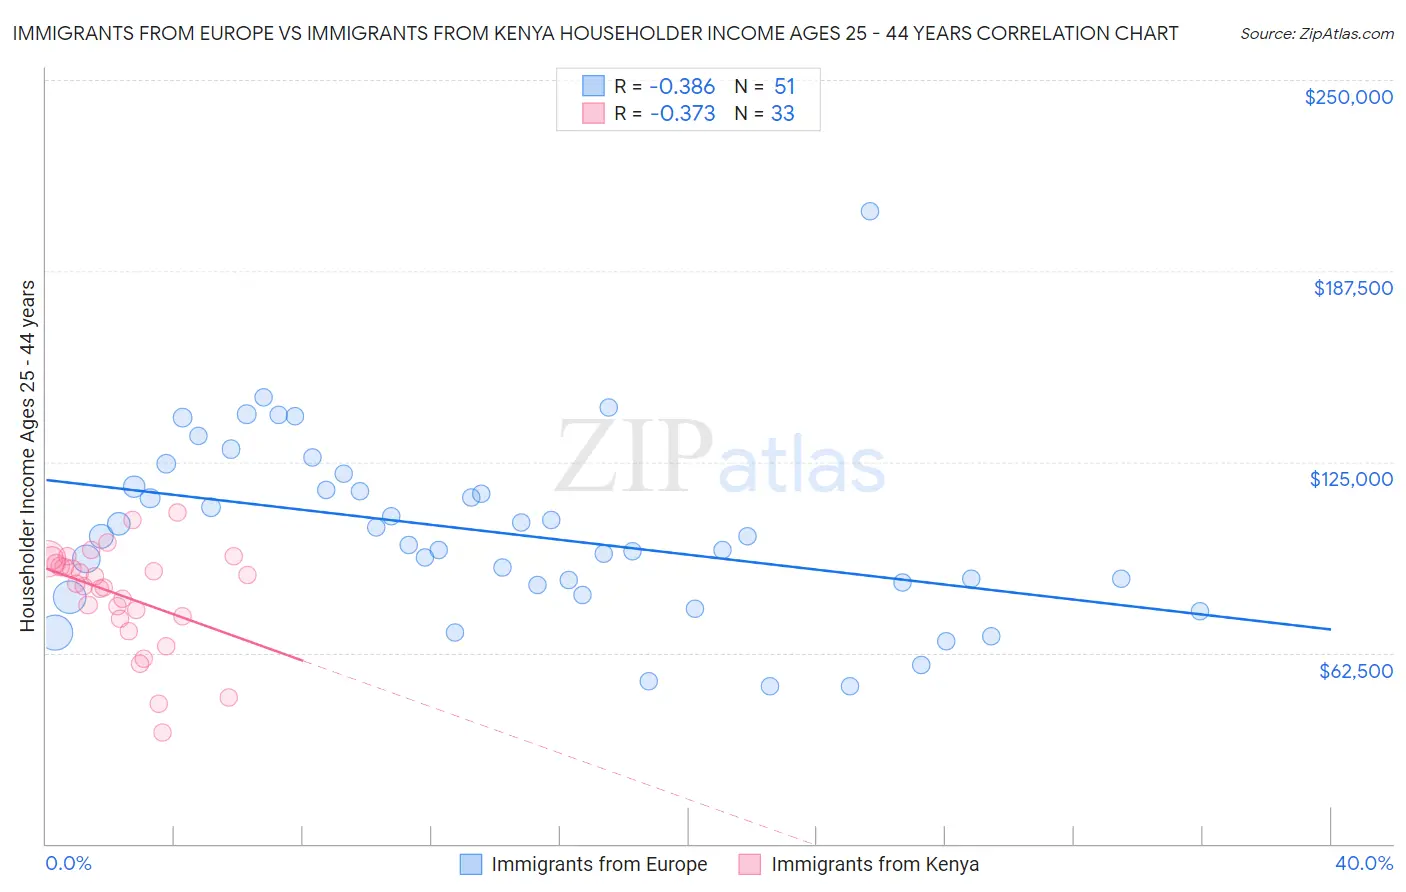
Immigrants from Europe vs Immigrants from Kenya Householder Income Ages 25 - 44 years Correlation Chart
The statistical analysis conducted on geographies consisting of 543,679,862 people shows a mild negative correlation between the proportion of Immigrants from Europe and household income with householder between the ages 25 and 44 in the United States with a correlation coefficient (R) of -0.386 and weighted average of $106,817. Similarly, the statistical analysis conducted on geographies consisting of 217,833,314 people shows a mild negative correlation between the proportion of Immigrants from Kenya and household income with householder between the ages 25 and 44 in the United States with a correlation coefficient (R) of -0.373 and weighted average of $90,767, a difference of 17.7%.
Householder Income Ages 25 - 44 years Correlation Summary
| Measurement | Immigrants from Europe | Immigrants from Kenya |
| Minimum | $51,500 | $36,409 |
| Maximum | $206,875 | $108,304 |
| Range | $155,375 | $71,895 |
| Mean | $102,137 | $81,270 |
| Median | $100,565 | $85,004 |
| Interquartile 25% (IQ1) | $84,881 | $73,989 |
| Interquartile 75% (IQ3) | $116,874 | $92,370 |
| Interquartile Range (IQR) | $31,993 | $18,381 |
| Standard Deviation (Sample) | $29,199 | $16,718 |
| Standard Deviation (Population) | $28,912 | $16,463 |
Similar Demographics by Householder Income Ages 25 - 44 years
Demographics Similar to Immigrants from Europe by Householder Income Ages 25 - 44 years
In terms of householder income ages 25 - 44 years, the demographic groups most similar to Immigrants from Europe are Immigrants from Czechoslovakia ($106,888, a difference of 0.070%), Immigrants from Norway ($106,629, a difference of 0.18%), Paraguayan ($106,615, a difference of 0.19%), Cambodian ($107,148, a difference of 0.31%), and Greek ($106,457, a difference of 0.34%).
| Demographics | Rating | Rank | Householder Income Ages 25 - 44 years |
| Israelis | 99.9 /100 | #45 | Exceptional $107,579 |
| Immigrants | Belarus | 99.9 /100 | #46 | Exceptional $107,393 |
| Estonians | 99.9 /100 | #47 | Exceptional $107,269 |
| Bulgarians | 99.9 /100 | #48 | Exceptional $107,264 |
| Immigrants | Turkey | 99.9 /100 | #49 | Exceptional $107,258 |
| Cambodians | 99.9 /100 | #50 | Exceptional $107,148 |
| Immigrants | Czechoslovakia | 99.9 /100 | #51 | Exceptional $106,888 |
| Immigrants | Europe | 99.9 /100 | #52 | Exceptional $106,817 |
| Immigrants | Norway | 99.9 /100 | #53 | Exceptional $106,629 |
| Paraguayans | 99.9 /100 | #54 | Exceptional $106,615 |
| Greeks | 99.9 /100 | #55 | Exceptional $106,457 |
| Immigrants | Pakistan | 99.8 /100 | #56 | Exceptional $106,129 |
| Immigrants | Austria | 99.8 /100 | #57 | Exceptional $106,103 |
| Immigrants | South Africa | 99.8 /100 | #58 | Exceptional $105,748 |
| Immigrants | Latvia | 99.8 /100 | #59 | Exceptional $105,522 |
Demographics Similar to Immigrants from Kenya by Householder Income Ages 25 - 44 years
In terms of householder income ages 25 - 44 years, the demographic groups most similar to Immigrants from Kenya are Iraqi ($90,764, a difference of 0.0%), Hawaiian ($90,722, a difference of 0.050%), Immigrants from Bangladesh ($90,448, a difference of 0.35%), Immigrants from Africa ($90,372, a difference of 0.44%), and Immigrants from Uruguay ($91,171, a difference of 0.45%).
| Demographics | Rating | Rank | Householder Income Ages 25 - 44 years |
| Immigrants | Cambodia | 15.7 /100 | #203 | Poor $91,533 |
| Nepalese | 15.4 /100 | #204 | Poor $91,498 |
| Immigrants | Eastern Africa | 15.2 /100 | #205 | Poor $91,458 |
| Aleuts | 14.5 /100 | #206 | Poor $91,370 |
| Yugoslavians | 14.5 /100 | #207 | Poor $91,368 |
| Immigrants | Thailand | 14.3 /100 | #208 | Poor $91,337 |
| Immigrants | Uruguay | 13.2 /100 | #209 | Poor $91,171 |
| Immigrants | Kenya | 10.9 /100 | #210 | Poor $90,767 |
| Iraqis | 10.8 /100 | #211 | Poor $90,764 |
| Hawaiians | 10.6 /100 | #212 | Poor $90,722 |
| Immigrants | Bangladesh | 9.3 /100 | #213 | Tragic $90,448 |
| Immigrants | Africa | 8.9 /100 | #214 | Tragic $90,372 |
| Panamanians | 8.1 /100 | #215 | Tragic $90,193 |
| Ghanaians | 7.9 /100 | #216 | Tragic $90,137 |
| Scotch-Irish | 7.3 /100 | #217 | Tragic $89,969 |