Immigrants from Fiji vs Immigrants from Malaysia 4 or more Vehicles in Household
COMPARE
Immigrants from Fiji
Immigrants from Malaysia
4 or more Vehicles in Household
4 or more Vehicles in Household Comparison
Immigrants from Fiji
Immigrants from Malaysia
9.6%
4 OR MORE VEHICLES IN HOUSEHOLD
100.0/ 100
METRIC RATING
5th/ 347
METRIC RANK
5.9%
4 OR MORE VEHICLES IN HOUSEHOLD
6.7/ 100
METRIC RATING
230th/ 347
METRIC RANK
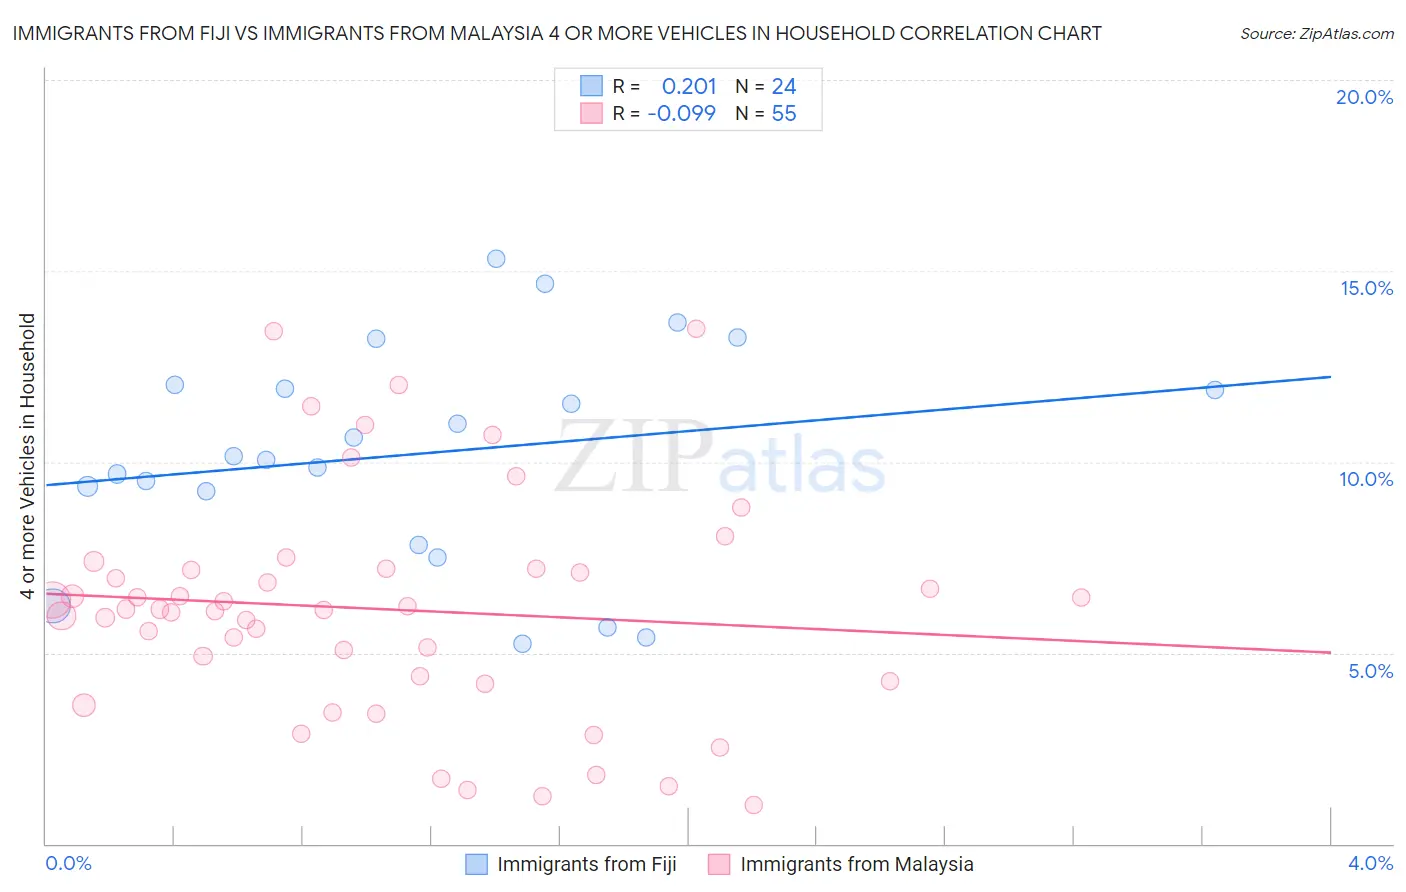
Immigrants from Fiji vs Immigrants from Malaysia 4 or more Vehicles in Household Correlation Chart
The statistical analysis conducted on geographies consisting of 93,730,930 people shows a weak positive correlation between the proportion of Immigrants from Fiji and percentage of households with 4 or more vehicles available in the United States with a correlation coefficient (R) of 0.201 and weighted average of 9.6%. Similarly, the statistical analysis conducted on geographies consisting of 197,160,103 people shows a slight negative correlation between the proportion of Immigrants from Malaysia and percentage of households with 4 or more vehicles available in the United States with a correlation coefficient (R) of -0.099 and weighted average of 5.9%, a difference of 63.1%.
4 or more Vehicles in Household Correlation Summary
| Measurement | Immigrants from Fiji | Immigrants from Malaysia |
| Minimum | 5.2% | 1.0% |
| Maximum | 15.3% | 13.5% |
| Range | 10.1% | 12.5% |
| Mean | 10.2% | 6.1% |
| Median | 10.1% | 6.1% |
| Interquartile 25% (IQ1) | 8.5% | 4.3% |
| Interquartile 75% (IQ3) | 12.0% | 7.2% |
| Interquartile Range (IQR) | 3.4% | 2.9% |
| Standard Deviation (Sample) | 2.9% | 2.9% |
| Standard Deviation (Population) | 2.8% | 2.9% |
Similar Demographics by 4 or more Vehicles in Household
Demographics Similar to Immigrants from Fiji by 4 or more Vehicles in Household
In terms of 4 or more vehicles in household, the demographic groups most similar to Immigrants from Fiji are Puget Sound Salish (9.4%, a difference of 2.5%), Native Hawaiian (9.4%, a difference of 2.6%), Arapaho (9.4%, a difference of 3.0%), Tongan (10.0%, a difference of 4.3%), and Samoan (9.2%, a difference of 4.4%).
| Demographics | Rating | Rank | 4 or more Vehicles in Household |
| Yakama | 100 /100 | #1 | Exceptional 12.9% |
| Colville | 100.0 /100 | #2 | Exceptional 11.1% |
| Spanish American Indians | 100.0 /100 | #3 | Exceptional 10.8% |
| Tongans | 100.0 /100 | #4 | Exceptional 10.0% |
| Immigrants | Fiji | 100.0 /100 | #5 | Exceptional 9.6% |
| Puget Sound Salish | 100.0 /100 | #6 | Exceptional 9.4% |
| Native Hawaiians | 100.0 /100 | #7 | Exceptional 9.4% |
| Arapaho | 100.0 /100 | #8 | Exceptional 9.4% |
| Samoans | 100.0 /100 | #9 | Exceptional 9.2% |
| Paiute | 100.0 /100 | #10 | Exceptional 9.0% |
| Immigrants | Mexico | 100.0 /100 | #11 | Exceptional 9.0% |
| Mexicans | 100.0 /100 | #12 | Exceptional 8.9% |
| Hawaiians | 100.0 /100 | #13 | Exceptional 8.9% |
| Chinese | 100.0 /100 | #14 | Exceptional 8.8% |
| Shoshone | 100.0 /100 | #15 | Exceptional 8.8% |
Demographics Similar to Immigrants from Malaysia by 4 or more Vehicles in Household
In terms of 4 or more vehicles in household, the demographic groups most similar to Immigrants from Malaysia are Eastern European (5.9%, a difference of 0.070%), Immigrants from Switzerland (5.9%, a difference of 0.12%), Immigrants from Argentina (5.9%, a difference of 0.30%), Sierra Leonean (5.9%, a difference of 0.31%), and Immigrants from Uganda (5.9%, a difference of 0.35%).
| Demographics | Rating | Rank | 4 or more Vehicles in Household |
| Immigrants | Kenya | 9.2 /100 | #223 | Tragic 6.0% |
| Cubans | 9.2 /100 | #224 | Tragic 6.0% |
| Indonesians | 8.9 /100 | #225 | Tragic 6.0% |
| Immigrants | Singapore | 7.9 /100 | #226 | Tragic 5.9% |
| Immigrants | Western Asia | 7.8 /100 | #227 | Tragic 5.9% |
| Immigrants | Uganda | 7.5 /100 | #228 | Tragic 5.9% |
| Eastern Europeans | 6.8 /100 | #229 | Tragic 5.9% |
| Immigrants | Malaysia | 6.7 /100 | #230 | Tragic 5.9% |
| Immigrants | Switzerland | 6.4 /100 | #231 | Tragic 5.9% |
| Immigrants | Argentina | 6.0 /100 | #232 | Tragic 5.9% |
| Sierra Leoneans | 6.0 /100 | #233 | Tragic 5.9% |
| Africans | 4.6 /100 | #234 | Tragic 5.8% |
| Immigrants | Hungary | 4.6 /100 | #235 | Tragic 5.8% |
| Immigrants | Eritrea | 4.5 /100 | #236 | Tragic 5.8% |
| Turks | 4.1 /100 | #237 | Tragic 5.8% |