Immigrants from Eastern Europe vs Nonimmigrants 1 or more Vehicles in Household
COMPARE
Immigrants from Eastern Europe
Nonimmigrants
1 or more Vehicles in Household
1 or more Vehicles in Household Comparison
Immigrants from Eastern Europe
Nonimmigrants
86.7%
1 OR MORE VEHICLES IN HOUSEHOLD
0.0/ 100
METRIC RATING
283rd/ 347
METRIC RANK
92.2%
1 OR MORE VEHICLES IN HOUSEHOLD
99.9/ 100
METRIC RATING
45th/ 347
METRIC RANK
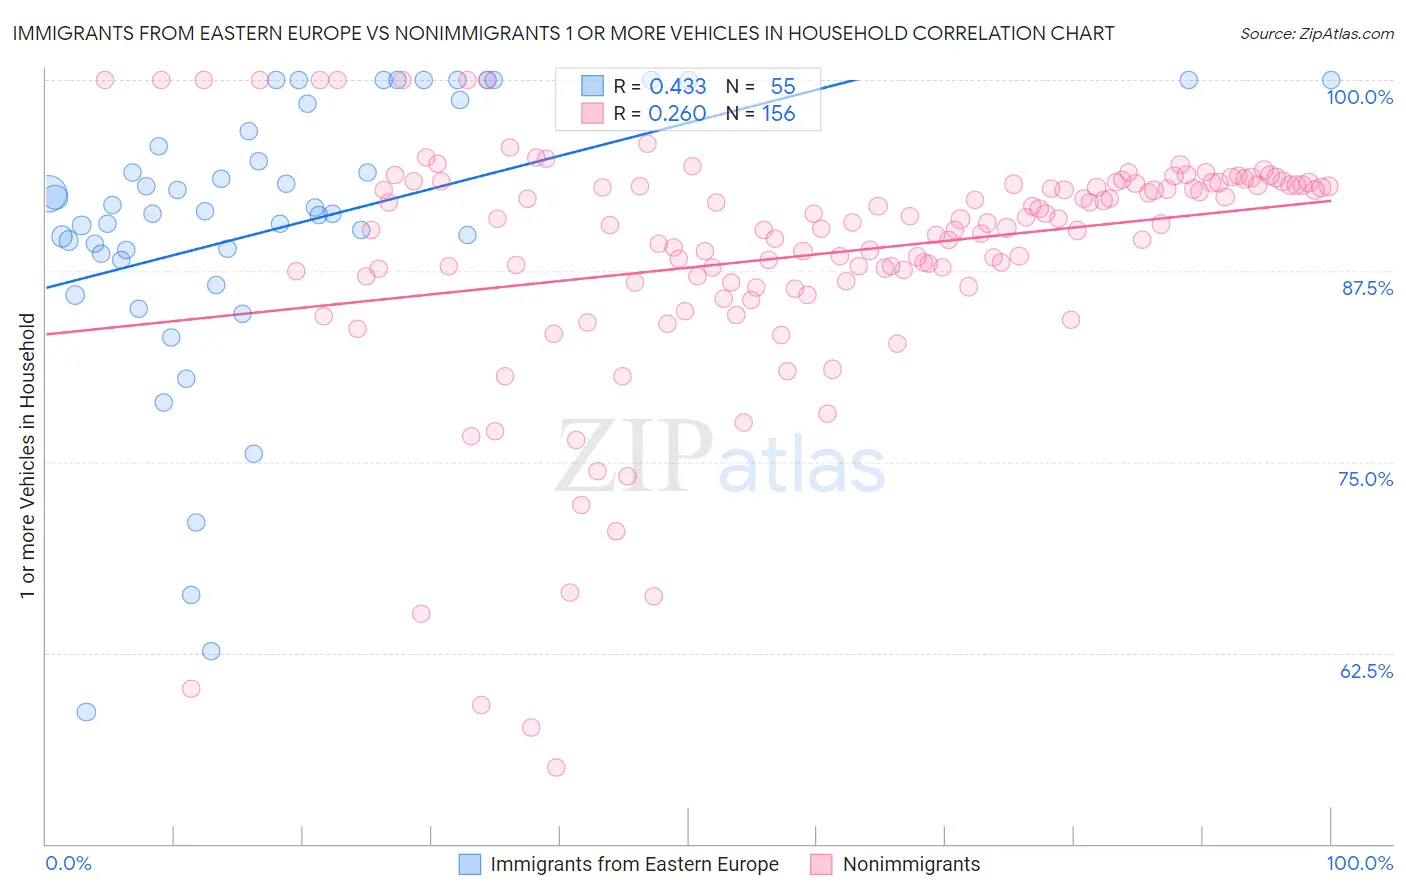
Immigrants from Eastern Europe vs Nonimmigrants 1 or more Vehicles in Household Correlation Chart
The statistical analysis conducted on geographies consisting of 475,429,921 people shows a moderate positive correlation between the proportion of Immigrants from Eastern Europe and percentage of households with 1 or more vehicles available in the United States with a correlation coefficient (R) of 0.433 and weighted average of 86.7%. Similarly, the statistical analysis conducted on geographies consisting of 574,303,261 people shows a weak positive correlation between the proportion of Nonimmigrants and percentage of households with 1 or more vehicles available in the United States with a correlation coefficient (R) of 0.260 and weighted average of 92.2%, a difference of 6.3%.
1 or more Vehicles in Household Correlation Summary
| Measurement | Immigrants from Eastern Europe | Nonimmigrants |
| Minimum | 58.6% | 55.0% |
| Maximum | 100.0% | 100.0% |
| Range | 41.4% | 45.0% |
| Mean | 90.4% | 88.6% |
| Median | 91.4% | 90.6% |
| Interquartile 25% (IQ1) | 88.6% | 87.0% |
| Interquartile 75% (IQ3) | 98.5% | 93.2% |
| Interquartile Range (IQR) | 9.8% | 6.2% |
| Standard Deviation (Sample) | 9.4% | 8.1% |
| Standard Deviation (Population) | 9.3% | 8.0% |
Similar Demographics by 1 or more Vehicles in Household
Demographics Similar to Immigrants from Eastern Europe by 1 or more Vehicles in Household
In terms of 1 or more vehicles in household, the demographic groups most similar to Immigrants from Eastern Europe are Central American Indian (86.7%, a difference of 0.0%), Colville (86.8%, a difference of 0.040%), Immigrants from Kazakhstan (86.6%, a difference of 0.21%), Immigrants from Eastern Asia (86.5%, a difference of 0.24%), and Mongolian (87.0%, a difference of 0.27%).
| Demographics | Rating | Rank | 1 or more Vehicles in Household |
| Immigrants | France | 0.1 /100 | #276 | Tragic 87.1% |
| Alsatians | 0.1 /100 | #277 | Tragic 87.1% |
| Immigrants | Southern Europe | 0.1 /100 | #278 | Tragic 87.1% |
| Immigrants | Albania | 0.1 /100 | #279 | Tragic 87.1% |
| Immigrants | Croatia | 0.0 /100 | #280 | Tragic 87.0% |
| Mongolians | 0.0 /100 | #281 | Tragic 87.0% |
| Colville | 0.0 /100 | #282 | Tragic 86.8% |
| Immigrants | Eastern Europe | 0.0 /100 | #283 | Tragic 86.7% |
| Central American Indians | 0.0 /100 | #284 | Tragic 86.7% |
| Immigrants | Kazakhstan | 0.0 /100 | #285 | Tragic 86.6% |
| Immigrants | Eastern Asia | 0.0 /100 | #286 | Tragic 86.5% |
| Immigrants | Malaysia | 0.0 /100 | #287 | Tragic 86.5% |
| Hopi | 0.0 /100 | #288 | Tragic 86.4% |
| Immigrants | Ireland | 0.0 /100 | #289 | Tragic 86.4% |
| Immigrants | Australia | 0.0 /100 | #290 | Tragic 86.4% |
Demographics Similar to Nonimmigrants by 1 or more Vehicles in Household
In terms of 1 or more vehicles in household, the demographic groups most similar to Nonimmigrants are Choctaw (92.2%, a difference of 0.020%), Immigrants from Fiji (92.2%, a difference of 0.020%), Northern European (92.2%, a difference of 0.030%), Spanish (92.3%, a difference of 0.040%), and Immigrants from Taiwan (92.3%, a difference of 0.050%).
| Demographics | Rating | Rank | 1 or more Vehicles in Household |
| Immigrants | Vietnam | 99.9 /100 | #38 | Exceptional 92.3% |
| Swiss | 99.9 /100 | #39 | Exceptional 92.3% |
| Creek | 99.9 /100 | #40 | Exceptional 92.3% |
| Immigrants | Taiwan | 99.9 /100 | #41 | Exceptional 92.3% |
| Chickasaw | 99.9 /100 | #42 | Exceptional 92.3% |
| Spanish | 99.9 /100 | #43 | Exceptional 92.3% |
| Choctaw | 99.9 /100 | #44 | Exceptional 92.2% |
| Immigrants | Nonimmigrants | 99.9 /100 | #45 | Exceptional 92.2% |
| Immigrants | Fiji | 99.9 /100 | #46 | Exceptional 92.2% |
| Northern Europeans | 99.9 /100 | #47 | Exceptional 92.2% |
| Belgians | 99.9 /100 | #48 | Exceptional 92.1% |
| Afghans | 99.9 /100 | #49 | Exceptional 92.1% |
| Guamanians/Chamorros | 99.9 /100 | #50 | Exceptional 92.1% |
| Celtics | 99.9 /100 | #51 | Exceptional 92.1% |
| Koreans | 99.9 /100 | #52 | Exceptional 92.1% |