Immigrants from Eastern Europe vs Houma 1 or more Vehicles in Household
COMPARE
Immigrants from Eastern Europe
Houma
1 or more Vehicles in Household
1 or more Vehicles in Household Comparison
Immigrants from Eastern Europe
Houma
86.7%
1 OR MORE VEHICLES IN HOUSEHOLD
0.0/ 100
METRIC RATING
283rd/ 347
METRIC RANK
88.6%
1 OR MORE VEHICLES IN HOUSEHOLD
4.8/ 100
METRIC RATING
233rd/ 347
METRIC RANK
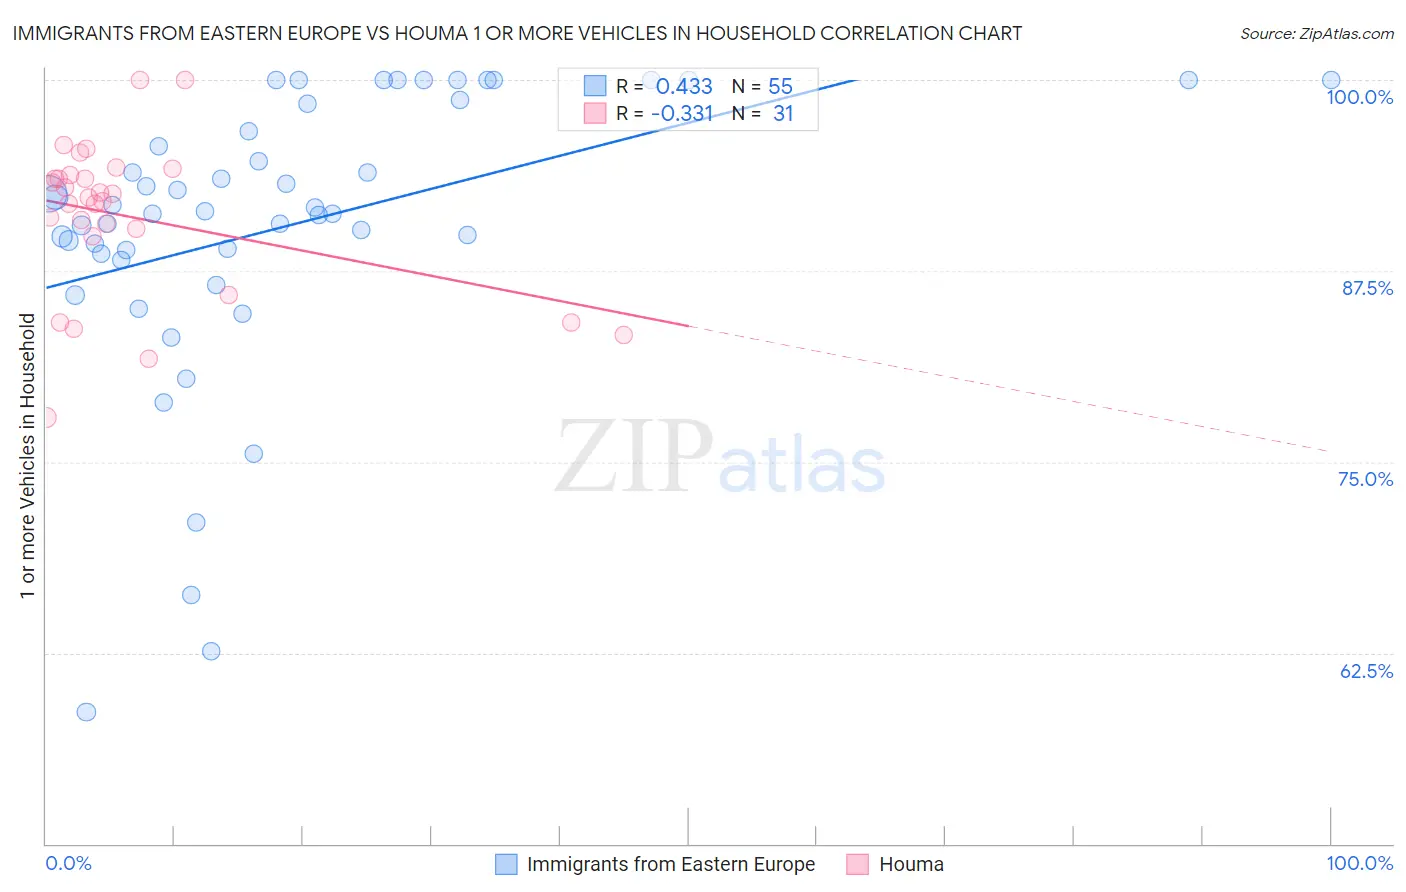
Immigrants from Eastern Europe vs Houma 1 or more Vehicles in Household Correlation Chart
The statistical analysis conducted on geographies consisting of 475,429,921 people shows a moderate positive correlation between the proportion of Immigrants from Eastern Europe and percentage of households with 1 or more vehicles available in the United States with a correlation coefficient (R) of 0.433 and weighted average of 86.7%. Similarly, the statistical analysis conducted on geographies consisting of 36,796,778 people shows a mild negative correlation between the proportion of Houma and percentage of households with 1 or more vehicles available in the United States with a correlation coefficient (R) of -0.331 and weighted average of 88.6%, a difference of 2.2%.
1 or more Vehicles in Household Correlation Summary
| Measurement | Immigrants from Eastern Europe | Houma |
| Minimum | 58.6% | 77.9% |
| Maximum | 100.0% | 100.0% |
| Range | 41.4% | 22.1% |
| Mean | 90.4% | 91.0% |
| Median | 91.4% | 92.3% |
| Interquartile 25% (IQ1) | 88.6% | 89.7% |
| Interquartile 75% (IQ3) | 98.5% | 93.8% |
| Interquartile Range (IQR) | 9.8% | 4.0% |
| Standard Deviation (Sample) | 9.4% | 5.1% |
| Standard Deviation (Population) | 9.3% | 5.0% |
Similar Demographics by 1 or more Vehicles in Household
Demographics Similar to Immigrants from Eastern Europe by 1 or more Vehicles in Household
In terms of 1 or more vehicles in household, the demographic groups most similar to Immigrants from Eastern Europe are Central American Indian (86.7%, a difference of 0.0%), Colville (86.8%, a difference of 0.040%), Immigrants from Kazakhstan (86.6%, a difference of 0.21%), Immigrants from Eastern Asia (86.5%, a difference of 0.24%), and Mongolian (87.0%, a difference of 0.27%).
| Demographics | Rating | Rank | 1 or more Vehicles in Household |
| Immigrants | France | 0.1 /100 | #276 | Tragic 87.1% |
| Alsatians | 0.1 /100 | #277 | Tragic 87.1% |
| Immigrants | Southern Europe | 0.1 /100 | #278 | Tragic 87.1% |
| Immigrants | Albania | 0.1 /100 | #279 | Tragic 87.1% |
| Immigrants | Croatia | 0.0 /100 | #280 | Tragic 87.0% |
| Mongolians | 0.0 /100 | #281 | Tragic 87.0% |
| Colville | 0.0 /100 | #282 | Tragic 86.8% |
| Immigrants | Eastern Europe | 0.0 /100 | #283 | Tragic 86.7% |
| Central American Indians | 0.0 /100 | #284 | Tragic 86.7% |
| Immigrants | Kazakhstan | 0.0 /100 | #285 | Tragic 86.6% |
| Immigrants | Eastern Asia | 0.0 /100 | #286 | Tragic 86.5% |
| Immigrants | Malaysia | 0.0 /100 | #287 | Tragic 86.5% |
| Hopi | 0.0 /100 | #288 | Tragic 86.4% |
| Immigrants | Ireland | 0.0 /100 | #289 | Tragic 86.4% |
| Immigrants | Australia | 0.0 /100 | #290 | Tragic 86.4% |
Demographics Similar to Houma by 1 or more Vehicles in Household
In terms of 1 or more vehicles in household, the demographic groups most similar to Houma are Immigrants from Japan (88.7%, a difference of 0.010%), Immigrants from Peru (88.6%, a difference of 0.010%), Paiute (88.6%, a difference of 0.010%), Russian (88.7%, a difference of 0.020%), and Immigrants from Pakistan (88.6%, a difference of 0.030%).
| Demographics | Rating | Rank | 1 or more Vehicles in Household |
| Cheyenne | 5.7 /100 | #226 | Tragic 88.7% |
| Ute | 5.6 /100 | #227 | Tragic 88.7% |
| Immigrants | Norway | 5.5 /100 | #228 | Tragic 88.7% |
| Immigrants | Romania | 5.4 /100 | #229 | Tragic 88.7% |
| Immigrants | Sierra Leone | 5.2 /100 | #230 | Tragic 88.7% |
| Russians | 5.0 /100 | #231 | Tragic 88.7% |
| Immigrants | Japan | 4.9 /100 | #232 | Tragic 88.7% |
| Houma | 4.8 /100 | #233 | Tragic 88.6% |
| Immigrants | Peru | 4.7 /100 | #234 | Tragic 88.6% |
| Paiute | 4.6 /100 | #235 | Tragic 88.6% |
| Immigrants | Pakistan | 4.5 /100 | #236 | Tragic 88.6% |
| Immigrants | Turkey | 4.4 /100 | #237 | Tragic 88.6% |
| Immigrants | Somalia | 4.2 /100 | #238 | Tragic 88.6% |
| Kiowa | 3.8 /100 | #239 | Tragic 88.6% |
| Eastern Europeans | 3.0 /100 | #240 | Tragic 88.5% |