Asian vs Houma 1 or more Vehicles in Household
COMPARE
Asian
Houma
1 or more Vehicles in Household
1 or more Vehicles in Household Comparison
Asians
Houma
91.1%
1 OR MORE VEHICLES IN HOUSEHOLD
98.2/ 100
METRIC RATING
104th/ 347
METRIC RANK
88.6%
1 OR MORE VEHICLES IN HOUSEHOLD
4.8/ 100
METRIC RATING
233rd/ 347
METRIC RANK
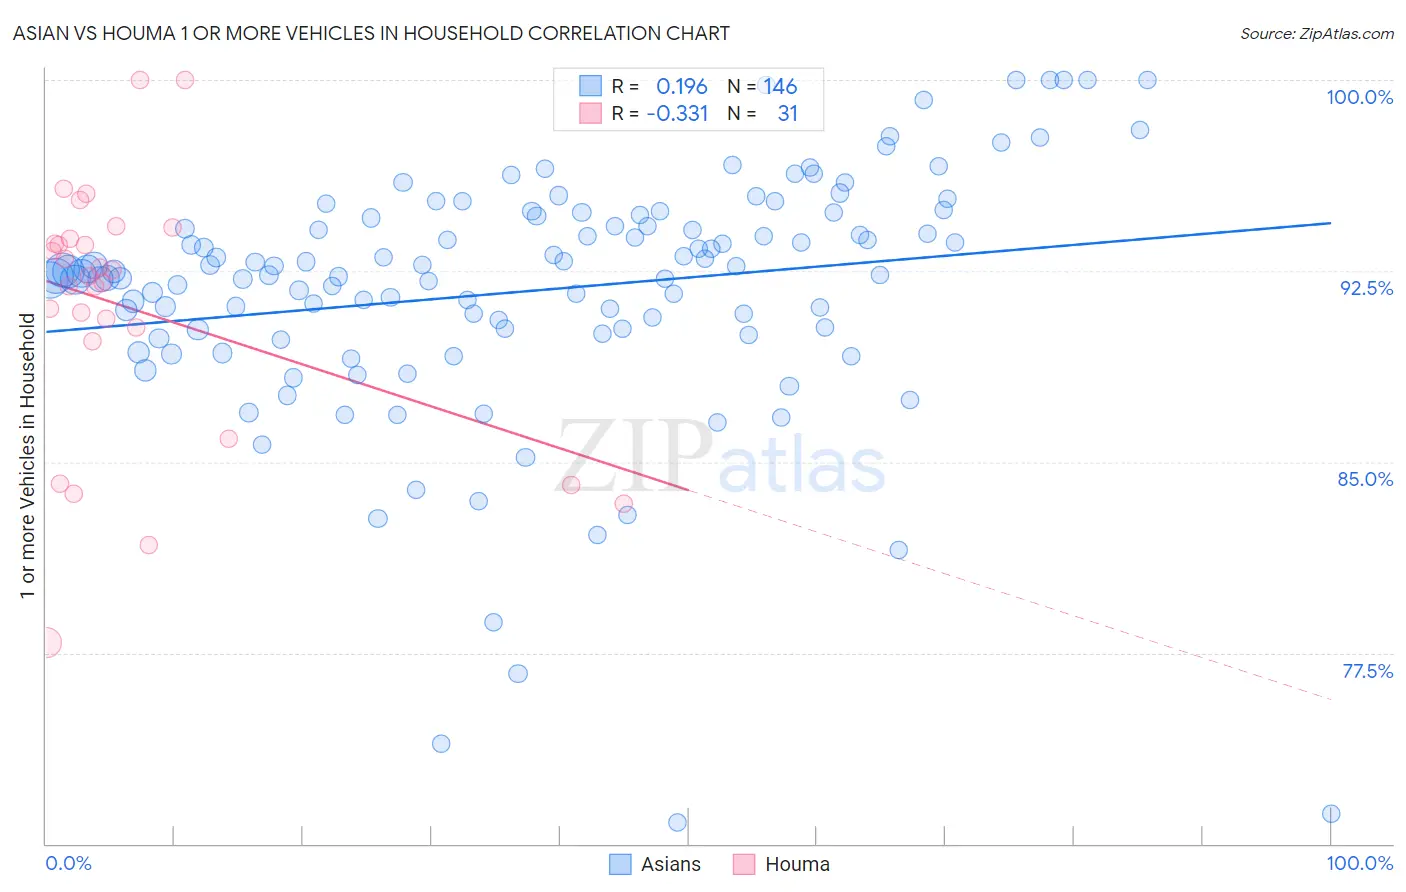
Asian vs Houma 1 or more Vehicles in Household Correlation Chart
The statistical analysis conducted on geographies consisting of 538,010,988 people shows a poor positive correlation between the proportion of Asians and percentage of households with 1 or more vehicles available in the United States with a correlation coefficient (R) of 0.196 and weighted average of 91.1%. Similarly, the statistical analysis conducted on geographies consisting of 36,796,778 people shows a mild negative correlation between the proportion of Houma and percentage of households with 1 or more vehicles available in the United States with a correlation coefficient (R) of -0.331 and weighted average of 88.6%, a difference of 2.8%.
1 or more Vehicles in Household Correlation Summary
| Measurement | Asian | Houma |
| Minimum | 70.8% | 77.9% |
| Maximum | 100.0% | 100.0% |
| Range | 29.2% | 22.1% |
| Mean | 91.7% | 91.0% |
| Median | 92.4% | 92.3% |
| Interquartile 25% (IQ1) | 90.2% | 89.7% |
| Interquartile 75% (IQ3) | 94.6% | 93.8% |
| Interquartile Range (IQR) | 4.4% | 4.0% |
| Standard Deviation (Sample) | 5.0% | 5.1% |
| Standard Deviation (Population) | 4.9% | 5.0% |
Similar Demographics by 1 or more Vehicles in Household
Demographics Similar to Asians by 1 or more Vehicles in Household
In terms of 1 or more vehicles in household, the demographic groups most similar to Asians are Yugoslavian (91.1%, a difference of 0.010%), Seminole (91.1%, a difference of 0.020%), Bulgarian (91.1%, a difference of 0.040%), Laotian (91.0%, a difference of 0.040%), and Immigrants from Central America (91.1%, a difference of 0.050%).
| Demographics | Rating | Rank | 1 or more Vehicles in Household |
| Pakistanis | 99.0 /100 | #97 | Exceptional 91.3% |
| Slavs | 98.7 /100 | #98 | Exceptional 91.2% |
| Immigrants | Bolivia | 98.6 /100 | #99 | Exceptional 91.2% |
| Immigrants | Central America | 98.4 /100 | #100 | Exceptional 91.1% |
| Bulgarians | 98.4 /100 | #101 | Exceptional 91.1% |
| Seminole | 98.3 /100 | #102 | Exceptional 91.1% |
| Yugoslavians | 98.3 /100 | #103 | Exceptional 91.1% |
| Asians | 98.2 /100 | #104 | Exceptional 91.1% |
| Laotians | 98.0 /100 | #105 | Exceptional 91.0% |
| Zimbabweans | 97.7 /100 | #106 | Exceptional 91.0% |
| Maltese | 97.7 /100 | #107 | Exceptional 91.0% |
| Hispanics or Latinos | 97.6 /100 | #108 | Exceptional 91.0% |
| Delaware | 97.6 /100 | #109 | Exceptional 91.0% |
| Mexican American Indians | 97.4 /100 | #110 | Exceptional 91.0% |
| Navajo | 95.8 /100 | #111 | Exceptional 90.8% |
Demographics Similar to Houma by 1 or more Vehicles in Household
In terms of 1 or more vehicles in household, the demographic groups most similar to Houma are Immigrants from Japan (88.7%, a difference of 0.010%), Immigrants from Peru (88.6%, a difference of 0.010%), Paiute (88.6%, a difference of 0.010%), Russian (88.7%, a difference of 0.020%), and Immigrants from Pakistan (88.6%, a difference of 0.030%).
| Demographics | Rating | Rank | 1 or more Vehicles in Household |
| Cheyenne | 5.7 /100 | #226 | Tragic 88.7% |
| Ute | 5.6 /100 | #227 | Tragic 88.7% |
| Immigrants | Norway | 5.5 /100 | #228 | Tragic 88.7% |
| Immigrants | Romania | 5.4 /100 | #229 | Tragic 88.7% |
| Immigrants | Sierra Leone | 5.2 /100 | #230 | Tragic 88.7% |
| Russians | 5.0 /100 | #231 | Tragic 88.7% |
| Immigrants | Japan | 4.9 /100 | #232 | Tragic 88.7% |
| Houma | 4.8 /100 | #233 | Tragic 88.6% |
| Immigrants | Peru | 4.7 /100 | #234 | Tragic 88.6% |
| Paiute | 4.6 /100 | #235 | Tragic 88.6% |
| Immigrants | Pakistan | 4.5 /100 | #236 | Tragic 88.6% |
| Immigrants | Turkey | 4.4 /100 | #237 | Tragic 88.6% |
| Immigrants | Somalia | 4.2 /100 | #238 | Tragic 88.6% |
| Kiowa | 3.8 /100 | #239 | Tragic 88.6% |
| Eastern Europeans | 3.0 /100 | #240 | Tragic 88.5% |